
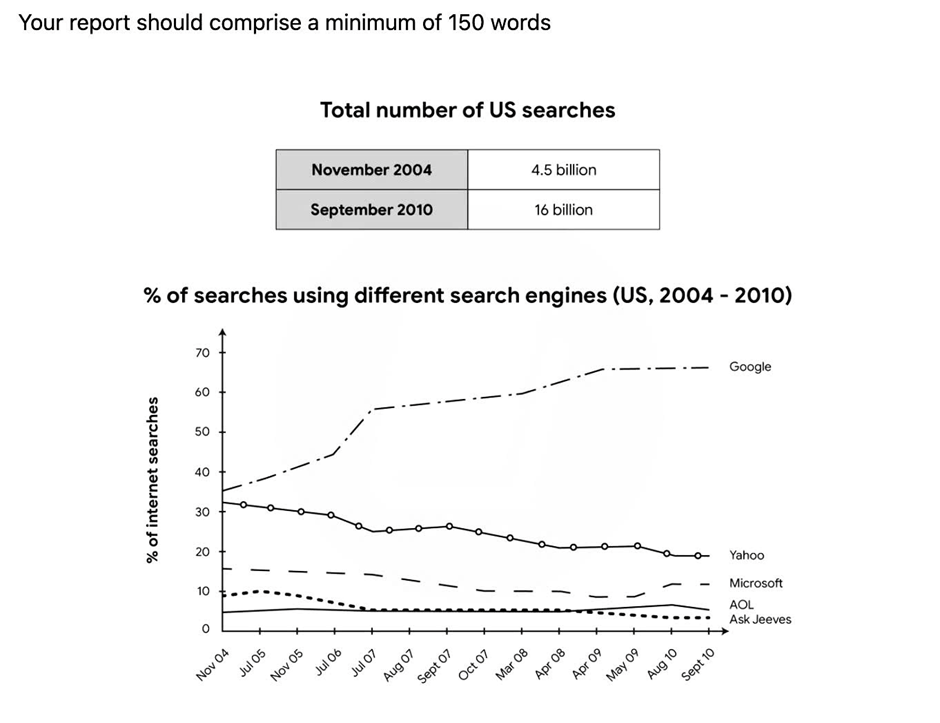
The table compares the average of United States looking for anything and the line graph provides the proportion of searches using four different application between 2004 and 2010. To begin with searches in America, in November 2004, the searching lead with 4.5 billion, which was recorded. Following this, the number of searches rose sharply by 16 billion after 6 years in September 2010. Recording the percentage of looking for everything by using different search machine, Google increased sharply from about 35% searches in November 2004 to around 70% in September 2010. Meanwhile, Yahoo and Ask Jeeves fell tin the first decade from 32% to 20% and from 9% to 4%, respectively. In addition, the research by AOL unchanged, and the Microsoft declined between 17% and 10% before rising to 20% in September 2010. Overall, Google had the highest total number of search engines throughout most of the period while the figure for the other application fluctuated or stable.
नमूना विवरण
The table and graph below give information on internet searches in the US between 2004 and 2010. Provide an overview of the information by identifying and describing the key details, and include comparisons where appropriate.
20/07/2026 17:43 5.0 अंक
विषय
The table and graph below give information on internet searches in the US between 2004 and 2010. Provide an overview of the information by identifying and describing the key details, and include comparisons where appropriate.
शब्दों की संख्या: 158
चार्ट/ग्राफ
Essay
समग्र स्कोर
5.0±0.5
बुनियादी
राइटिंग मानदंड स्कोर
TA5.0
CC6.0
LR5.0
GRA5.0
सुधार के विस्तृत सुझाव देखने के लिए लेख में किसी भी हाइलाइट किए गए टेक्स्ट पर क्लिक करें।
गहन विश्लेषण
Task 1 - Academic Writing
4 उपकरण उपलब्ध
नमूना लेख - IELTS Writing Task 1
कोई नमूना लेख नहीं
Task 1 के लिए उच्च-गुणवत्ता वाला नमूना लेख विश्लेषण और बनाने के लिए नीचे दिए गए बटन पर क्लिक करें।