
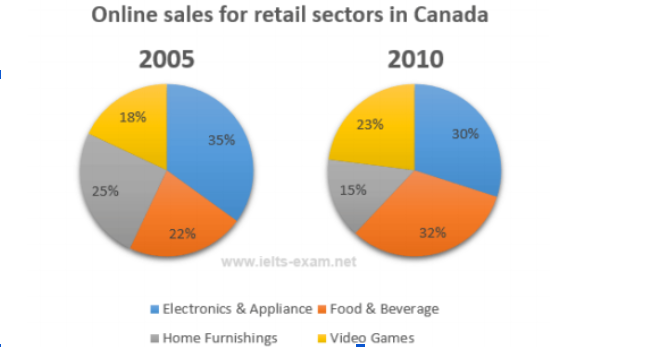
The two pie charts given illustrate online shopping sales in Canada in 2005 and 2010. Overall, it is evident that the proportions of food & beverage and video games purchased steadily rose. However, a reverse pattern could be observed in electronics & appliances and home furnishings, which experienced a gradual decrease in Canada in the final year. In 2005, the percentage of electronics & appliances sold was highest at 35%, whereas the rate of video games was lowest at 18%, which was roughly half of the figure for electronics. Meanwhile, the rates of food & beverage and home furnishings accounted for 22% and 25%, respectively, in the first period. In 2010, the proportion of purchased food & beverage climbed significantly to 32%, and became the most popular category. In addition, there was a moderate increase in the percentage of video games sold to 23%. In contrast, the sales figures for electronics & appliances and home furnishings dropped consistently to 30% and 15%, respectively.
Sample Detail
The two pie charts below show the online shopping sales for retail sectors in Canada in 2005 and 2010.
21/07/2026 04:43 7.5 points
Topic
The two pie charts below show the online shopping sales for retail sectors in Canada in 2005 and 2010.
Word count: 163
Chart/Graph
Essay
Overall Scores
7.5±0.5
Good
Writing Criteria Scores
TA8.0
CC8.0
LR7.0
GRA8.0
Click on any highlighted text in the essay to view detailed suggestions for improvement.
Deep Analysis
Task 1 - Academic Writing
4 tools available
Sample Essay - IELTS Writing Task 1
No sample essay
Click the button below to analyze and generate a high-quality sample essay for Task 1.