
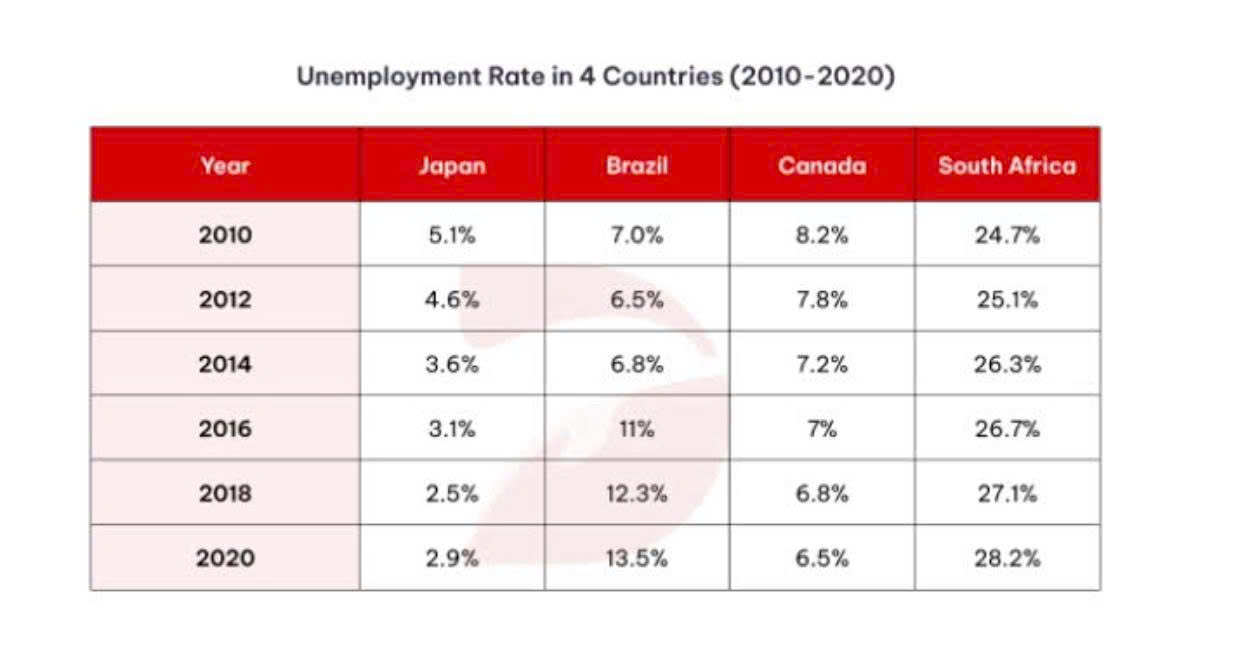
The chart provides information on the levels of unemployment in four different countries over the course of 10 years, starting from 2010. What stands out from the chart is that all countries recorded an increase except for Japan and Canada, although South Africa experienced the most significant growth during the entire period. At the start of the period, securing the top position was South Africa, as its figure stood at 24.7%. This was followed by Brazil, Canada, which recorded around 7% and 8%, while the figure for Japan is slightly lower, at 5%. Examining each country’s trajectory, the percentage of joblessness in South Africa experienced a noticeable growth throughout the period and finished at around 28% in 2020. Likewise, the unemployment rate in Brazil dropped to around 7% in 2014 before seeing a sharp increase to 13.5% in 2020. Conversely, the percentage point in Canada witnessed a negligible plunge during the entire period and stopped at 6.5% in 2020. Finally, the unemployment levels in Japan hit a low of 2.5% in 2018 but later rose steeply to around 3% at the end of the period.
নমুনা বিস্তারিত
The table below shows the unemployment rate in four countries from 2010 to 2020. Write a report for a university lecturer describing the information shown below.
21/07/2026 04:58 7.0 স্কোর
টপিক বা বিষয়
The table below shows the unemployment rate in four countries from 2010 to 2020. Write a report for a university lecturer describing the information shown below.
শব্দ সংখ্যা: 185
চার্ট/গ্রাফ
Essay
সামগ্রিক স্কোর
7.0±0.5
ভালো
রাইটিং মানদণ্ড স্কোর
TA7.0
CC8.0
LR7.0
GRA7.0
উন্নতির জন্য বিস্তারিত পরামর্শ দেখতে প্রবন্ধের হাইলাইট করা যেকোনো লেখায় ক্লিক করুন।
গভীর বিশ্লেষণ
Task 1 - Academic Writing
4 tools available
নমুনা রচনা - IELTS Writing Task 1
কোনো নমুনা রচনা নেই
টাস্ক ১-এর জন্য উচ্চমানের নমুনা রচনা বিশ্লেষণ এবং তৈরি করতে নিচের বাটনে ক্লিক করুন।