
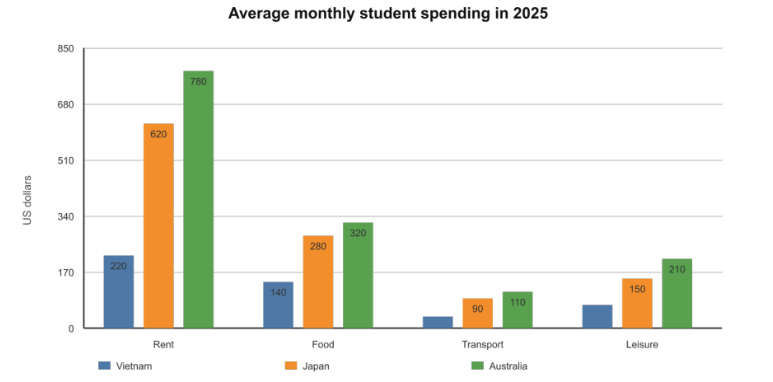
The bar graph delineates the monthly expenses of students, on average and in US dollars, in three nations in 2025. Overall, students commonly spent their budgets on rent and food; specifically, rent was the most important option among students, while the reverse trend was true for travelling. Additionally, the rank of Vietnam, Japan and Australia was respectively recorded with the lowest in Vietnam and the highest in Australia. Regarding the essential fields, renting was initially prioritized by Australian students at 780, followed by Japanese and Vietnamese students at 620 and 220 in turn. Similarly, Australian students allocated 320 on food, which was higher than Japanese ones by 40, and Vietnamese ones by 180. Concerning the remaining expenses, continuing the trend of the former, students in all three separated countries spent a remarkable amount of money on entertainment activities, translating to the peak of Australia at 210 and the low of Vietnam at around 75. Lastly, transport was cost-efficiently purchased by Vietnam, Japan and Australia, which was respectively nearly 35%, precisely 90 and 110.
Sample Detail
The bar chart shows average monthly spending by students in three countries in 2025.
21/07/2026 05:01 5.5 points
Topic
The bar chart shows average monthly spending by students in three countries in 2025.
Word count: 173
Chart/Graph
Essay
Overall Scores
5.5±0.5
Basic
Writing Criteria Scores
TA5.0
CC6.0
LR6.0
GRA6.0
Click on any highlighted text in the essay to view detailed suggestions for improvement.
Deep Analysis
Task 1 - Academic Writing
4 tools available
Sample Essay - IELTS Writing Task 1
No sample essay
Click the button below to analyze and generate a high-quality sample essay for Task 1.