
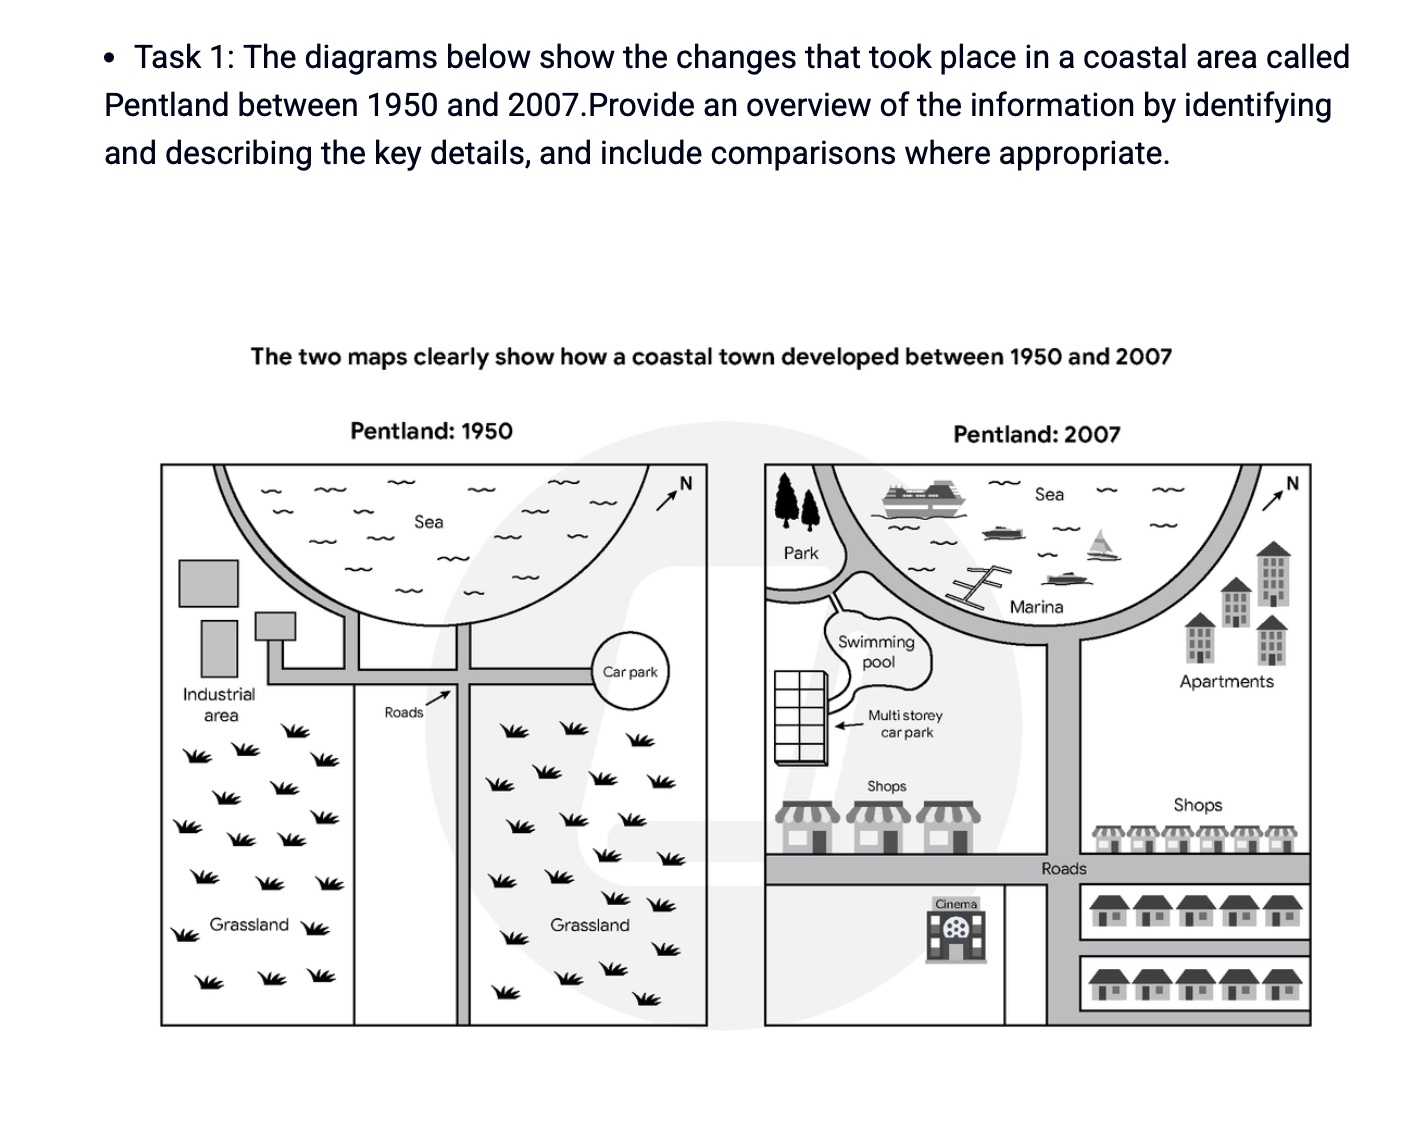
The diagrams illustrate differences in a coastal area called Pentland between 1950 and 2007. Overall, the area was extensively redeveloped, becoming a far more residential and recreational coastal town over the period. There was expansion of the roads through weeding, and the addition of many amenities. In 1950, large areas of grassland occupied the southern part of the town, which was later cleared mainly for extending, widening, and branching road. There were just a few buildings for industrial activity in 1950, which was also later replaced with a new route separating a park and a swimming pool next to a multi-storey car park by 2007. The road which was built alongside a part of seashore was then widened and extended to cover the entire coastline. Several boats and ships appeared in the marina. From the sea, the road led directly to the intersection where more several new facilities were constructed, including a cinema, rows of houses, and several shops. Additionally, towards the north and nearby the road by the coastline stood apartment buildings instead of the car park in 1950.
รายละเอียดตัวอย่าง
The diagrams below show the changes that took place in a coastal area called Pentland between 1950 and 2007. Provide an overview of the information by identifying and describing the key details, and include comparisons where appropriate.
21/07/2026 05:04 6.5 คะแนน
หัวข้อ
The diagrams below show the changes that took place in a coastal area called Pentland between 1950 and 2007. Provide an overview of the information by identifying and describing the key details, and include comparisons where appropriate.
จำนวนคำ: 180
แผนภูมิ/กราฟ
Essay
คะแนนรวม
6.5±0.5
ดีพอใช้
คะแนนเกณฑ์การเขียน
TA7.0
CC7.0
LR6.0
GRA7.0
คลิกข้อความที่ไฮไลต์ในเรียงความเพื่อดูคำแนะนำรายละเอียดเพื่อพัฒนา
การวิเคราะห์เชิงลึก
Task 1 - Academic Writing
4 tools available
บทความตัวอย่าง - IELTS Writing Task 1
ยังไม่มีบทความตัวอย่าง
กดปุ่มด้านล่างเพื่อวิเคราะห์และสร้างบทความตัวอย่างคุณภาพสูงสำหรับ Task 1