
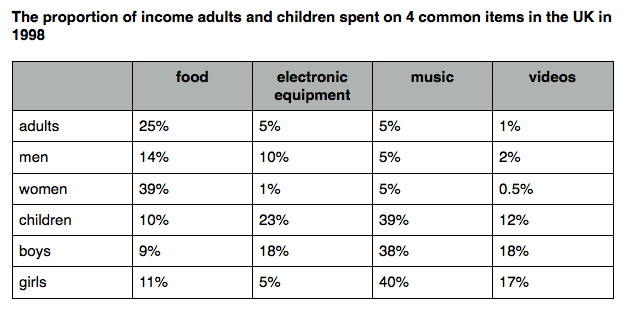
The given chart illustrates how much income adults and children spent on different items in the UK in the year 1998. Overall, it is clear that women spent most of their income on food while that of electronic, music and videos was the lowest of all the total. Additionally, it is common in music which was spent highly in children, boys and girls throughout the period. According to the chart, the percentage of revenue women spent on food far exceeded that of adults and men, with respective being 39%, 25% and 14%. Furthermore, the figures for girls, children and boys are roughly equal, at 11%, 10% and 9% in that order. Notably, the proportion of children’s income spent on electronic equipment was 23%, followed by boys (18%) and men (10%). Moreover, the incomes of girls, adults and women spent on electronic equipment were less common, which accounted for 5%, 5% and 1%, respectively. In addition, the percentage of income girls spent on music (at 40%) far exceeded that of children and boys, with the figures being 39% and 38%, respectively. Notably, 5% of the proportions of income of adults, men and women were relatively similar in 1998. Besides, the figure for boys’ income spent on videos was 18%, which was higher than girls (17%) and children (12%), compared to that of men, adults and women, with respective figures being 2%, 1% and 0,5% in that order.
নমুনা বিস্তারিত
The proportion of income adults and children spent on 4 common items in the UK on 1998.
21/07/2026 05:14 6.0 স্কোর
টপিক বা বিষয়
The proportion of income adults and children spent on 4 common items in the UK on 1998.
শব্দ সংখ্যা: 236
চার্ট/গ্রাফ
Essay
সামগ্রিক স্কোর
6.0±0.5
মোটামুটি
রাইটিং মানদণ্ড স্কোর
TA6.0
CC6.0
LR6.0
GRA6.0
উন্নতির জন্য বিস্তারিত পরামর্শ দেখতে প্রবন্ধের হাইলাইট করা যেকোনো লেখায় ক্লিক করুন।
গভীর বিশ্লেষণ
Task 1 - Academic Writing
4 tools available
নমুনা রচনা - IELTS Writing Task 1
কোনো নমুনা রচনা নেই
টাস্ক ১-এর জন্য উচ্চমানের নমুনা রচনা বিশ্লেষণ এবং তৈরি করতে নিচের বাটনে ক্লিক করুন।