
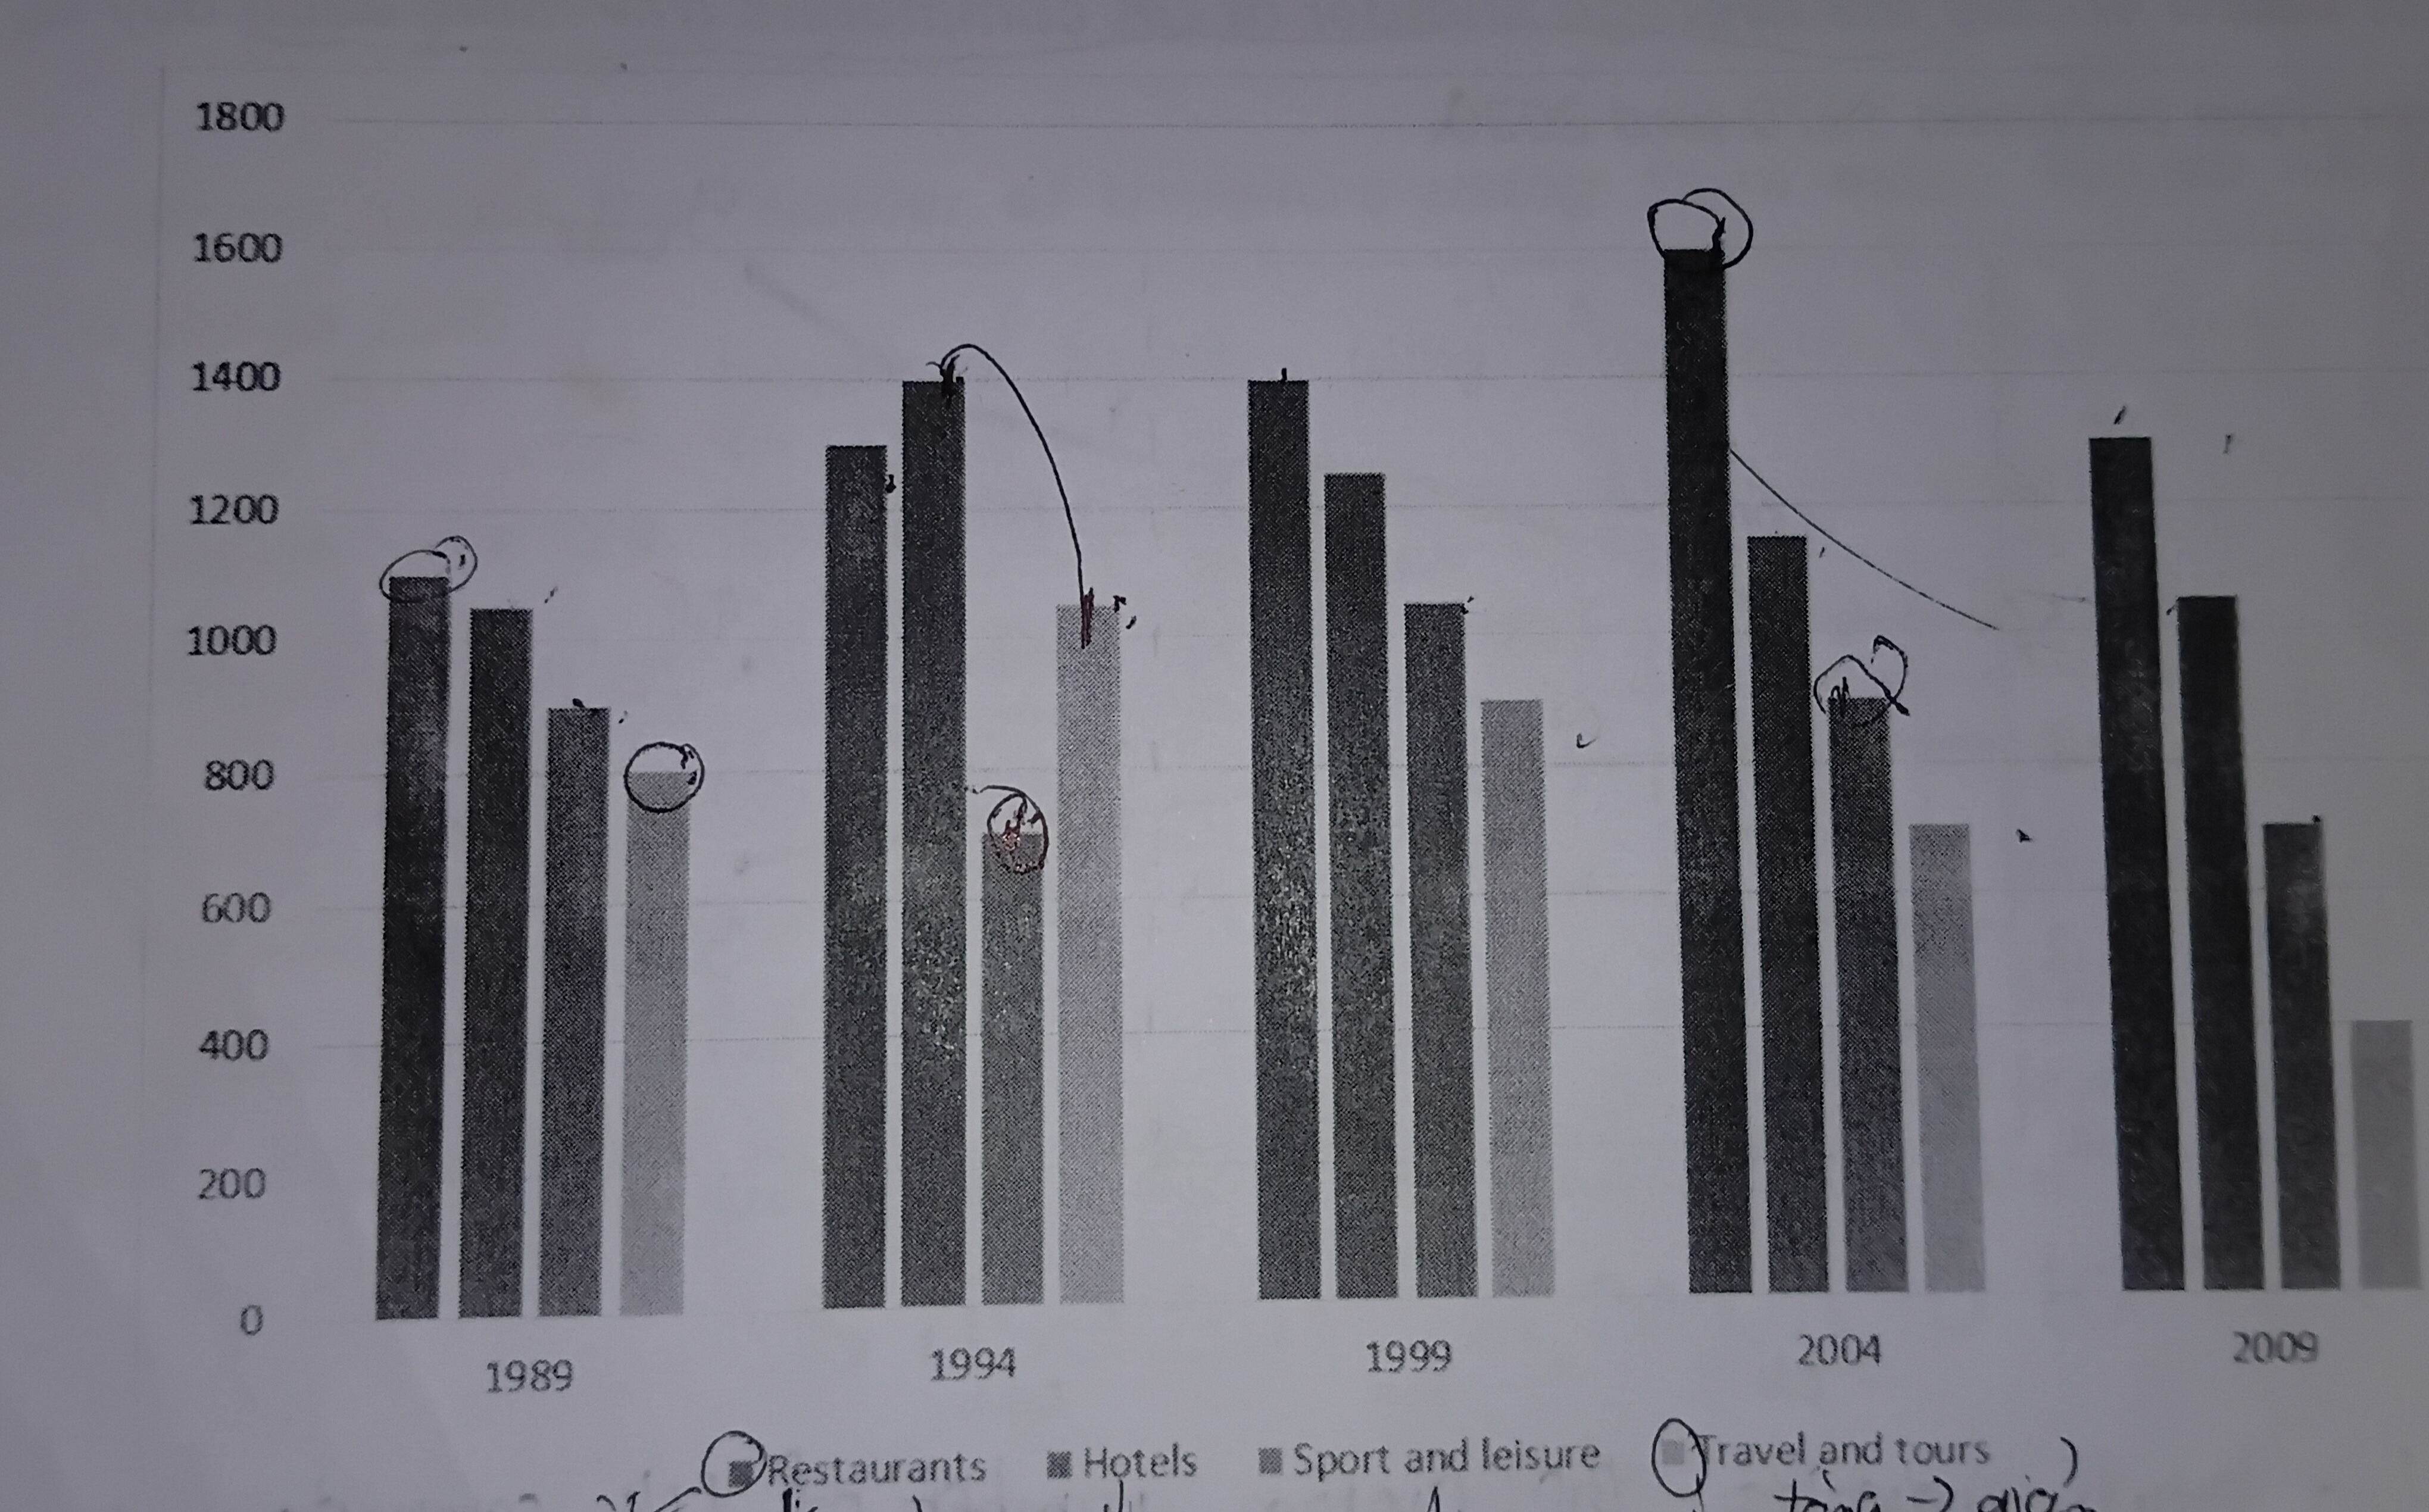
The chart illustrates the number of jobs in tourism-related industries of restaurants was the highest in the majority of the given time. On the other hand, the figure for travel/tours was the lowest in the majority of the given time. In 1989, the number of jobs in tourism-related industries in restaurants was about 1100. This was followed by the figures for hotels, sport/leisure and travel/tours, at about 1050, 840 and 800, respectively. By 2009, the numbers of jobs in tourism-related industries of hotels and travel/tours rose to hits peak of about 1400 and 1050, respectively in 1994. But then they decline to 1050 and 400, respectively in 2009. However, the figure for restaurants experienced significant increase to hit a peak of 1600 in 2004, before decreasing to 1300 in 2009. Finally, the number of jobs in tourism-related industries of sport/leisure reduced to hit the bottom of 700 in 1994, but then it increase to around 1050 in 1999, before going down to 700 in 2009
Detail Sampel
The chart below shows the number of jobs in tourism-related industries in one UK city between 1989 and 2009
21/07/2026 05:28 6.0 skor
Topik
The chart below shows the number of jobs in tourism-related industries in one UK city between 1989 and 2009
Jumlah kata: 165
Grafik/Diagram
Essay
Skor Keseluruhan
6.0±0.5
Cukup
Skor Kriteria Writing
TA6.0
CC6.0
LR6.0
GRA6.0
Klik teks yang ditandai di esai untuk melihat saran detail untuk peningkatan.
Analisis mendalam
Task 1 - Academic Writing
4 tools available
Esai contoh - IELTS Writing Task 1
Belum ada esai contoh
Silakan klik tombol di bawah untuk menganalisis dan membuat esai contoh berkualitas tinggi untuk Task 1.