
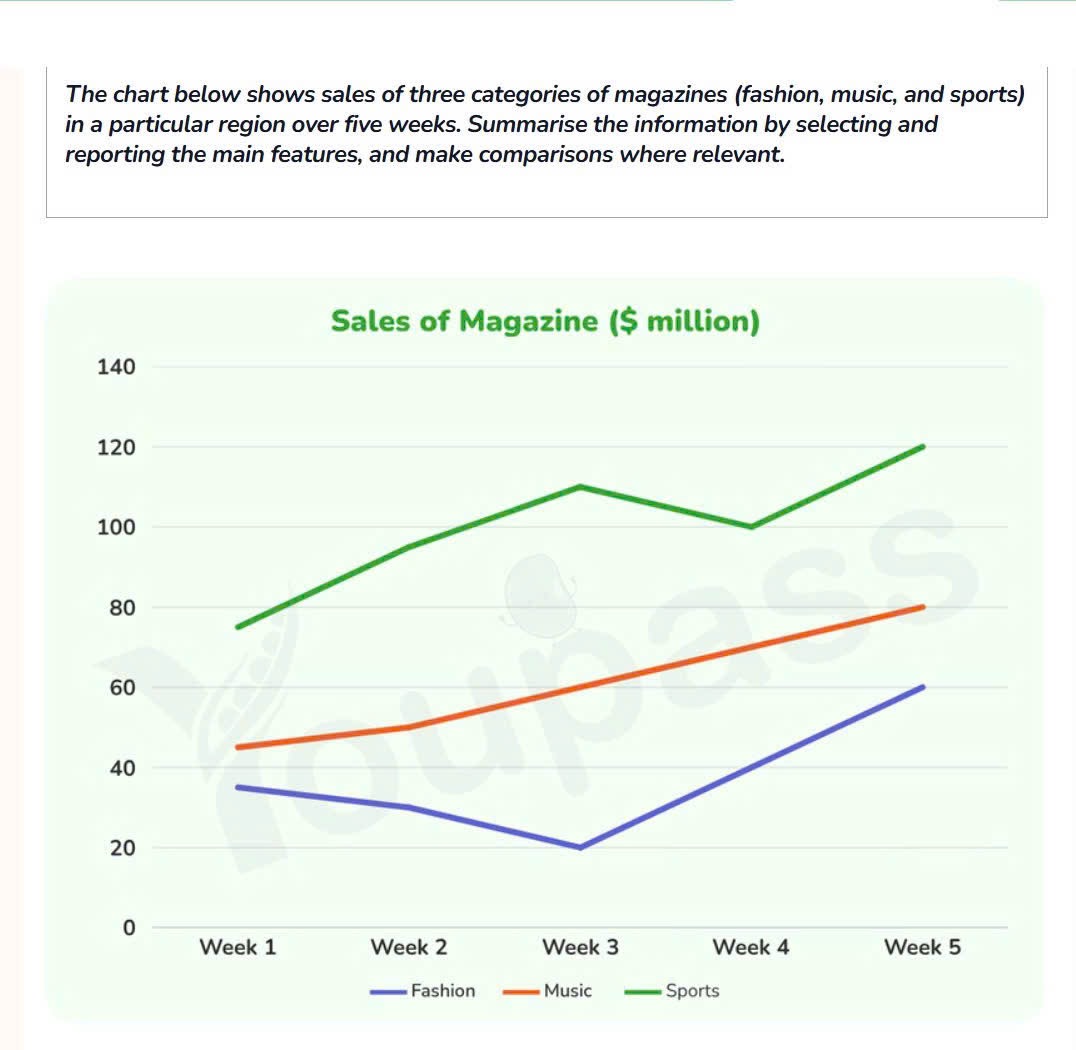
The provided line graph illustrates the amount of money generated from selling three different types of publications over a period of five weeks. Overall, the quantity of money made from music and sports magazines show an upward trend and sport magazines were always the most popular, while that of fashion publications was the lowest. To begin with, approximately 75 units were recorded in week 1 for the sales of sport magazines. The period from week 1 to week 3 witnessed a steady upward climb, reaching around 110 units. Despite a brief drop to 100 units in the four weeks, a strong recovery was maintained by this magazine, allowing its revenue to peak at 120 units by week 5. Looking at the remaining categories, the revenue from music and fashion magazines stood at 45 and 35 units respectively in the first week. The subsequent four weeks saw a continuous rise in data for music magazines, which increased progressively to finish at 80 units. Conversely, a noticeable dip to a low of 20 units in week was exhibited by fashion magazines, before its sales rebounded significantly to end at 60 units in week 5.
Sample Detail
the chart below shoes sales of thee categories of magazines (fashion, music and sports) in a particular region over five weeks
21/07/2026 05:32 7.0 points
Topic
the chart below shoes sales of thee categories of magazines (fashion, music and sports) in a particular region over five weeks
Word count: 192
Chart/Graph
Essay
Overall Scores
7.0±0.5
Good
Writing Criteria Scores
TA7.0
CC7.0
LR7.0
GRA7.0
Click on any highlighted text in the essay to view detailed suggestions for improvement.
Deep Analysis
Task 1 - Academic Writing
4 tools available
Sample Essay - IELTS Writing Task 1
No sample essay
Click the button below to analyze and generate a high-quality sample essay for Task 1.