
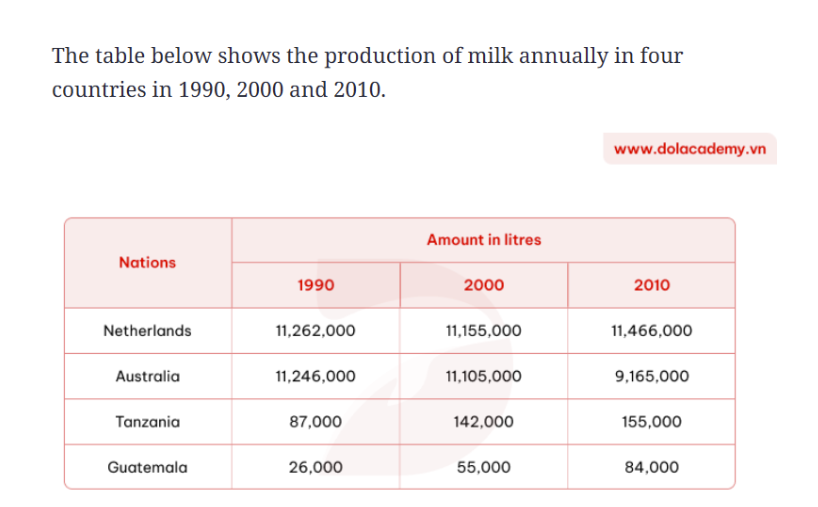
The table demonstrates the annual milk production across 4 distinct nations in 1990, 2000 and 2010. Overall, milk production in Australia declined while the amount in remaining countries experienced a net increase. Furthermore, Guatemala exhibited the largest growth while the Netherlands accounted for the most liters of milk throughout the years. In 1990, the Netherlands accounted for the highest amount of milk , starting at roughly 11,262,000 liters before increasing further to nearly 11,470,000 in 2010. Tanzania, on the other hand, contributed 87,000 liters of milk at the beginning of the period. By 2000, the amount had reached 142,000 liters, after which it grew slightly to 155,000 in the following decade. Regarding milk production in Guatemala, it stayed consistently low over the 20-year-period. By 2010, the country had produced 84,000 liters of milk, more than triple of the amount in 1990. Additionally, there was a notable drop in Australia’s milk production, decreasing from approximately 11,246,000 to below 10,000,000 liters in 2010.
รายละเอียดตัวอย่าง
The table below shows the production of milk annually in four countries in 1990, 2000 and 2010.
21/07/2026 05:38 8.0 คะแนน
หัวข้อ
The table below shows the production of milk annually in four countries in 1990, 2000 and 2010.
จำนวนคำ: 161
แผนภูมิ/กราฟ
Essay
คะแนนรวม
8.0±0.5
ยอดเยี่ยม
คะแนนเกณฑ์การเขียน
TA8.0
CC8.0
LR8.0
GRA8.0
คลิกข้อความที่ไฮไลต์ในเรียงความเพื่อดูคำแนะนำรายละเอียดเพื่อพัฒนา
การวิเคราะห์เชิงลึก
Task 1 - Academic Writing
4 tools available
บทความตัวอย่าง - IELTS Writing Task 1
ยังไม่มีบทความตัวอย่าง
กดปุ่มด้านล่างเพื่อวิเคราะห์และสร้างบทความตัวอย่างคุณภาพสูงสำหรับ Task 1