
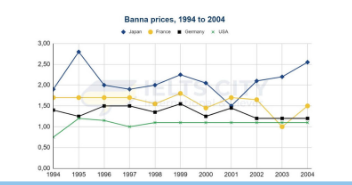
The line graph illustrates information about banana prices in Japan, Germany, France, and the USA from 1994 to 2004. Overall, it is clear that prices in Japan and the USA witnessed an upward trend, while the opposite was true for Germany and France. Also, it was the most expensive to buy bananas in Japan for most of the period, while the USA remained the cheapest for almost all years. The prices of bananas in Japan experienced the sharpest fluctuations. In the first year, this figure soared from under $2 to a peak of around $2.75, before falling back to the previous level the next year. From 1996 to 2002, prices fluctuated strongly with the lowest point of $1.5 in 2001, after which they slowly recovered to over $2.5 in 2004. In contrast, bananas in the USA were mostly stable in prices, with their value first climbed noticeably from around $0.75 to $1.25. This number then stayed constant at just above $1 in the remaining period. Both the costs of German and French bananas recorded minor volatility. The figure for France remained at $1.75 from 1994 to 1997, which then experienced erratic movements until the end, overtaking Japan in 2001 and reaching the bottom of $1 in 2003. Similarly, throughout the period, prices of bananas in Germany varied slightly, ranging from around $1.5 to $1.
รายละเอียดตัวอย่าง
The graph below shows the prices of bananas in four countries between 1994 and 2004.
21/07/2026 05:51 7.0 คะแนน
หัวข้อ
The graph below shows the prices of bananas in four countries between 1994 and 2004.
จำนวนคำ: 224
แผนภูมิ/กราฟ
Essay
คะแนนรวม
7.0±0.5
ดีมาก
คะแนนเกณฑ์การเขียน
TA7.0
CC7.0
LR7.0
GRA7.0
คลิกข้อความที่ไฮไลต์ในเรียงความเพื่อดูคำแนะนำรายละเอียดเพื่อพัฒนา
การวิเคราะห์เชิงลึก
Task 1 - Academic Writing
4 tools available
บทความตัวอย่าง - IELTS Writing Task 1
ยังไม่มีบทความตัวอย่าง
กดปุ่มด้านล่างเพื่อวิเคราะห์และสร้างบทความตัวอย่างคุณภาพสูงสำหรับ Task 1