
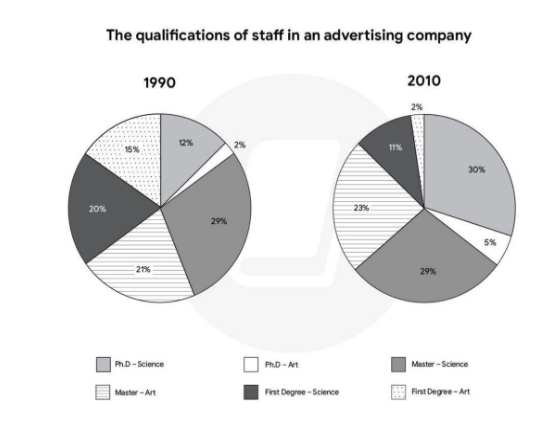
The two pie compare the qualifications of employees in an advertising company between 1990 and 2010. Overall, the company employed a higher proportion of staff with postgraduate qualification in 2010, particularly requiring mostly PhD-science. Meanwhile, the percentage of staff having a Master’s degree in Science remained unchanged. In contrast, the figure for first degrees decreased. Looking first at postgraduate qualifications, the percentage of employees with a PhD in Science rose dramatically from 12% in 1990to 30% in 2010, making it the largest category in the latter year. Although PhD in Art had a similar trend when starting at 2% and ending at 5%, this degree was employed almost the lowest. Regarding Master’s degrees, the proportion of the staff with a Master’s in Science remained stable at 29%, while the percentage of those with a Master’s in Art stood at 21% before going up by 2%. By contrast, the share of employees with first degrees declined over the period. The proportion of staff holding a first degree in Science fell from 20% to 11%, whereas the figure for first-degree in Art dropped much more sharply, from 15% to only 2%, representing the biggest decrease among all categories.
รายละเอียดตัวอย่าง
The charts below show the qualifications of staff in an advertising company in 1990 and 2010.
21/07/2026 05:59 7.0 คะแนน
หัวข้อ
The charts below show the qualifications of staff in an advertising company in 1990 and 2010.
จำนวนคำ: 196
แผนภูมิ/กราฟ
Essay
คะแนนรวม
7.0±0.5
ดีมาก
คะแนนเกณฑ์การเขียน
TA7.0
CC7.0
LR7.0
GRA7.0
คลิกข้อความที่ไฮไลต์ในเรียงความเพื่อดูคำแนะนำรายละเอียดเพื่อพัฒนา
การวิเคราะห์เชิงลึก
Task 1 - Academic Writing
4 tools available
บทความตัวอย่าง - IELTS Writing Task 1
ยังไม่มีบทความตัวอย่าง
กดปุ่มด้านล่างเพื่อวิเคราะห์และสร้างบทความตัวอย่างคุณภาพสูงสำหรับ Task 1