
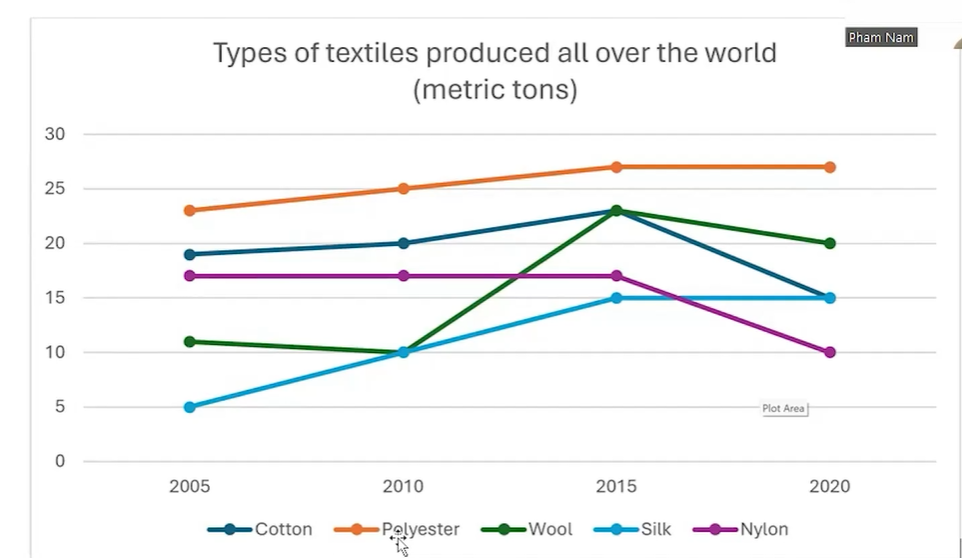
The chart compares five different types of textiles which are produced in worldwide from 2005 to 2020, measured in metric tons. Overall, polyester was a leading source with the top figures from the beginning to the end of the period. Silk was recorded as a lowest category from 2005 before increasing sharply in the next few years. The remaining textiles include cotton, wool and nylon had the changes in years, wool had its first time overtook cotton in 2015. All of them also experienced the decrease by the end of the period while polyester and silk remained stable. In 2005, polyester at the top of textiles increased gradually from 23 metric tons to 25 in 2010, continuously rising in 2015 and reaching its peak at 27. Polyester then remained unchanged at this figure by the end of the period in 2020. By contrast, silk was recorded with just 5 metric tons in 2005, which made it become the lowest category by the beginning. Silk then rose dramatically to 10 metric tons in 2010, before remaining stable at 15 from 2015 to 2020. Three remaining textiles seemingly in the same trend in some last years. Firstly, Cotton experienced a slight growth from 19 metric tons to 20 between 2005 and 2010. It then rose to 23 metric tons in 2015 before dropping sharply to just 15 in 2020. Wool decreased slightly from 11 metric tons to 10 in 2010, when it had the same figure with silk. From 2010 to 2015, wool rose significantly to 23 metric tons, marking its overtaking from cotton. Wool then decreased to 20 at the end in 2020. Comparing with others, nylon experienced the most small change throughout the period, having no change from 2005 to 2015 at 17 metric tons, it then fell sharply to 10 by the end in 2020.
Detail Sampel
The chart below shows information on the number of different textiles produced in the world between 2005 and 2020. Summarize the information by selecting and reporting the main features and make comparisons where relevant.
21/07/2026 06:22 6.5 skor
Topik
The chart below shows information on the number of different textiles produced in the world between 2005 and 2020. Summarize the information by selecting and reporting the main features and make comparisons where relevant.
Jumlah kata: 306
Grafik/Diagram
Essay
Skor Keseluruhan
6.5±0.5
Cukup
Skor Kriteria Writing
TA7.0
CC7.0
LR6.0
GRA6.0
Klik teks yang ditandai di esai untuk melihat saran detail untuk peningkatan.
Analisis mendalam
Task 1 - Academic Writing
4 tools available
Esai contoh - IELTS Writing Task 1
Belum ada esai contoh
Silakan klik tombol di bawah untuk menganalisis dan membuat esai contoh berkualitas tinggi untuk Task 1.