
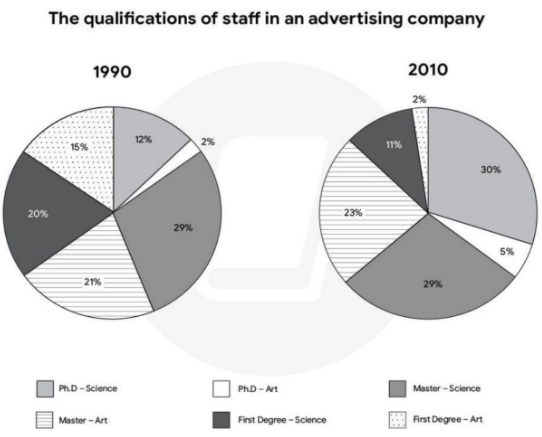
The pie chart illustrates the proportions of employees’ qualifications in a commercial company in six different types ( Ph.D-Science, Ph.D-Art, Master-Science, Master-Art, First Degree-Science and First Degree-Art) in 1990 and 2010. Overall, the percentages of qualifications in two kinds of Ph.D. and Master-Art increased, while that of First Degree - Science and Art declined. It is noteworthy that the rate of people having Master- Science qualification remained unchanged in the examined years. Looking first at Ph.D-Science, Ph.D. - Art and Master - Art, their rates witnessed an upward trend. Ph.D. - Science’s proportion surging from 12% in 1990 to 30% in 2010, making this qualification the dominant one. Meanwhile, Ph.D.Art rose slightly from 2% to 5%, followed by Master’s Art, which also grew modestly from 20% to 23%. Turning to First Degree - Science and Art, their proportions saw a downward trend. First degree-Science’s figure nearly halved from 20% to just 11%. Similarly, the proportion of first degree in art dropped dramatically from 15% to 2%, becoming the least popular qualification. In terms of Master -Science, this type of qualification ranked first in 1990, at 29%, and stayed constant in 2010. This unchanged figure resulted in this category being overtaken, thereby dropping to second place.
Detail Sampel
the chart below shows the qualifications of staff in an advertising company in 1990 and 2010
21/07/2026 06:33 7.0 skor
Topik
the chart below shows the qualifications of staff in an advertising company in 1990 and 2010
Jumlah kata: 205
Grafik/Diagram
Essay
Skor Keseluruhan
7.0±0.5
Baik
Skor Kriteria Writing
TA7.0
CC7.0
LR7.0
GRA7.0
Klik teks yang ditandai di esai untuk melihat saran detail untuk peningkatan.
Analisis mendalam
Task 1 - Academic Writing
4 tools available
Esai contoh - IELTS Writing Task 1
Belum ada esai contoh
Silakan klik tombol di bawah untuk menganalisis dan membuat esai contoh berkualitas tinggi untuk Task 1.