
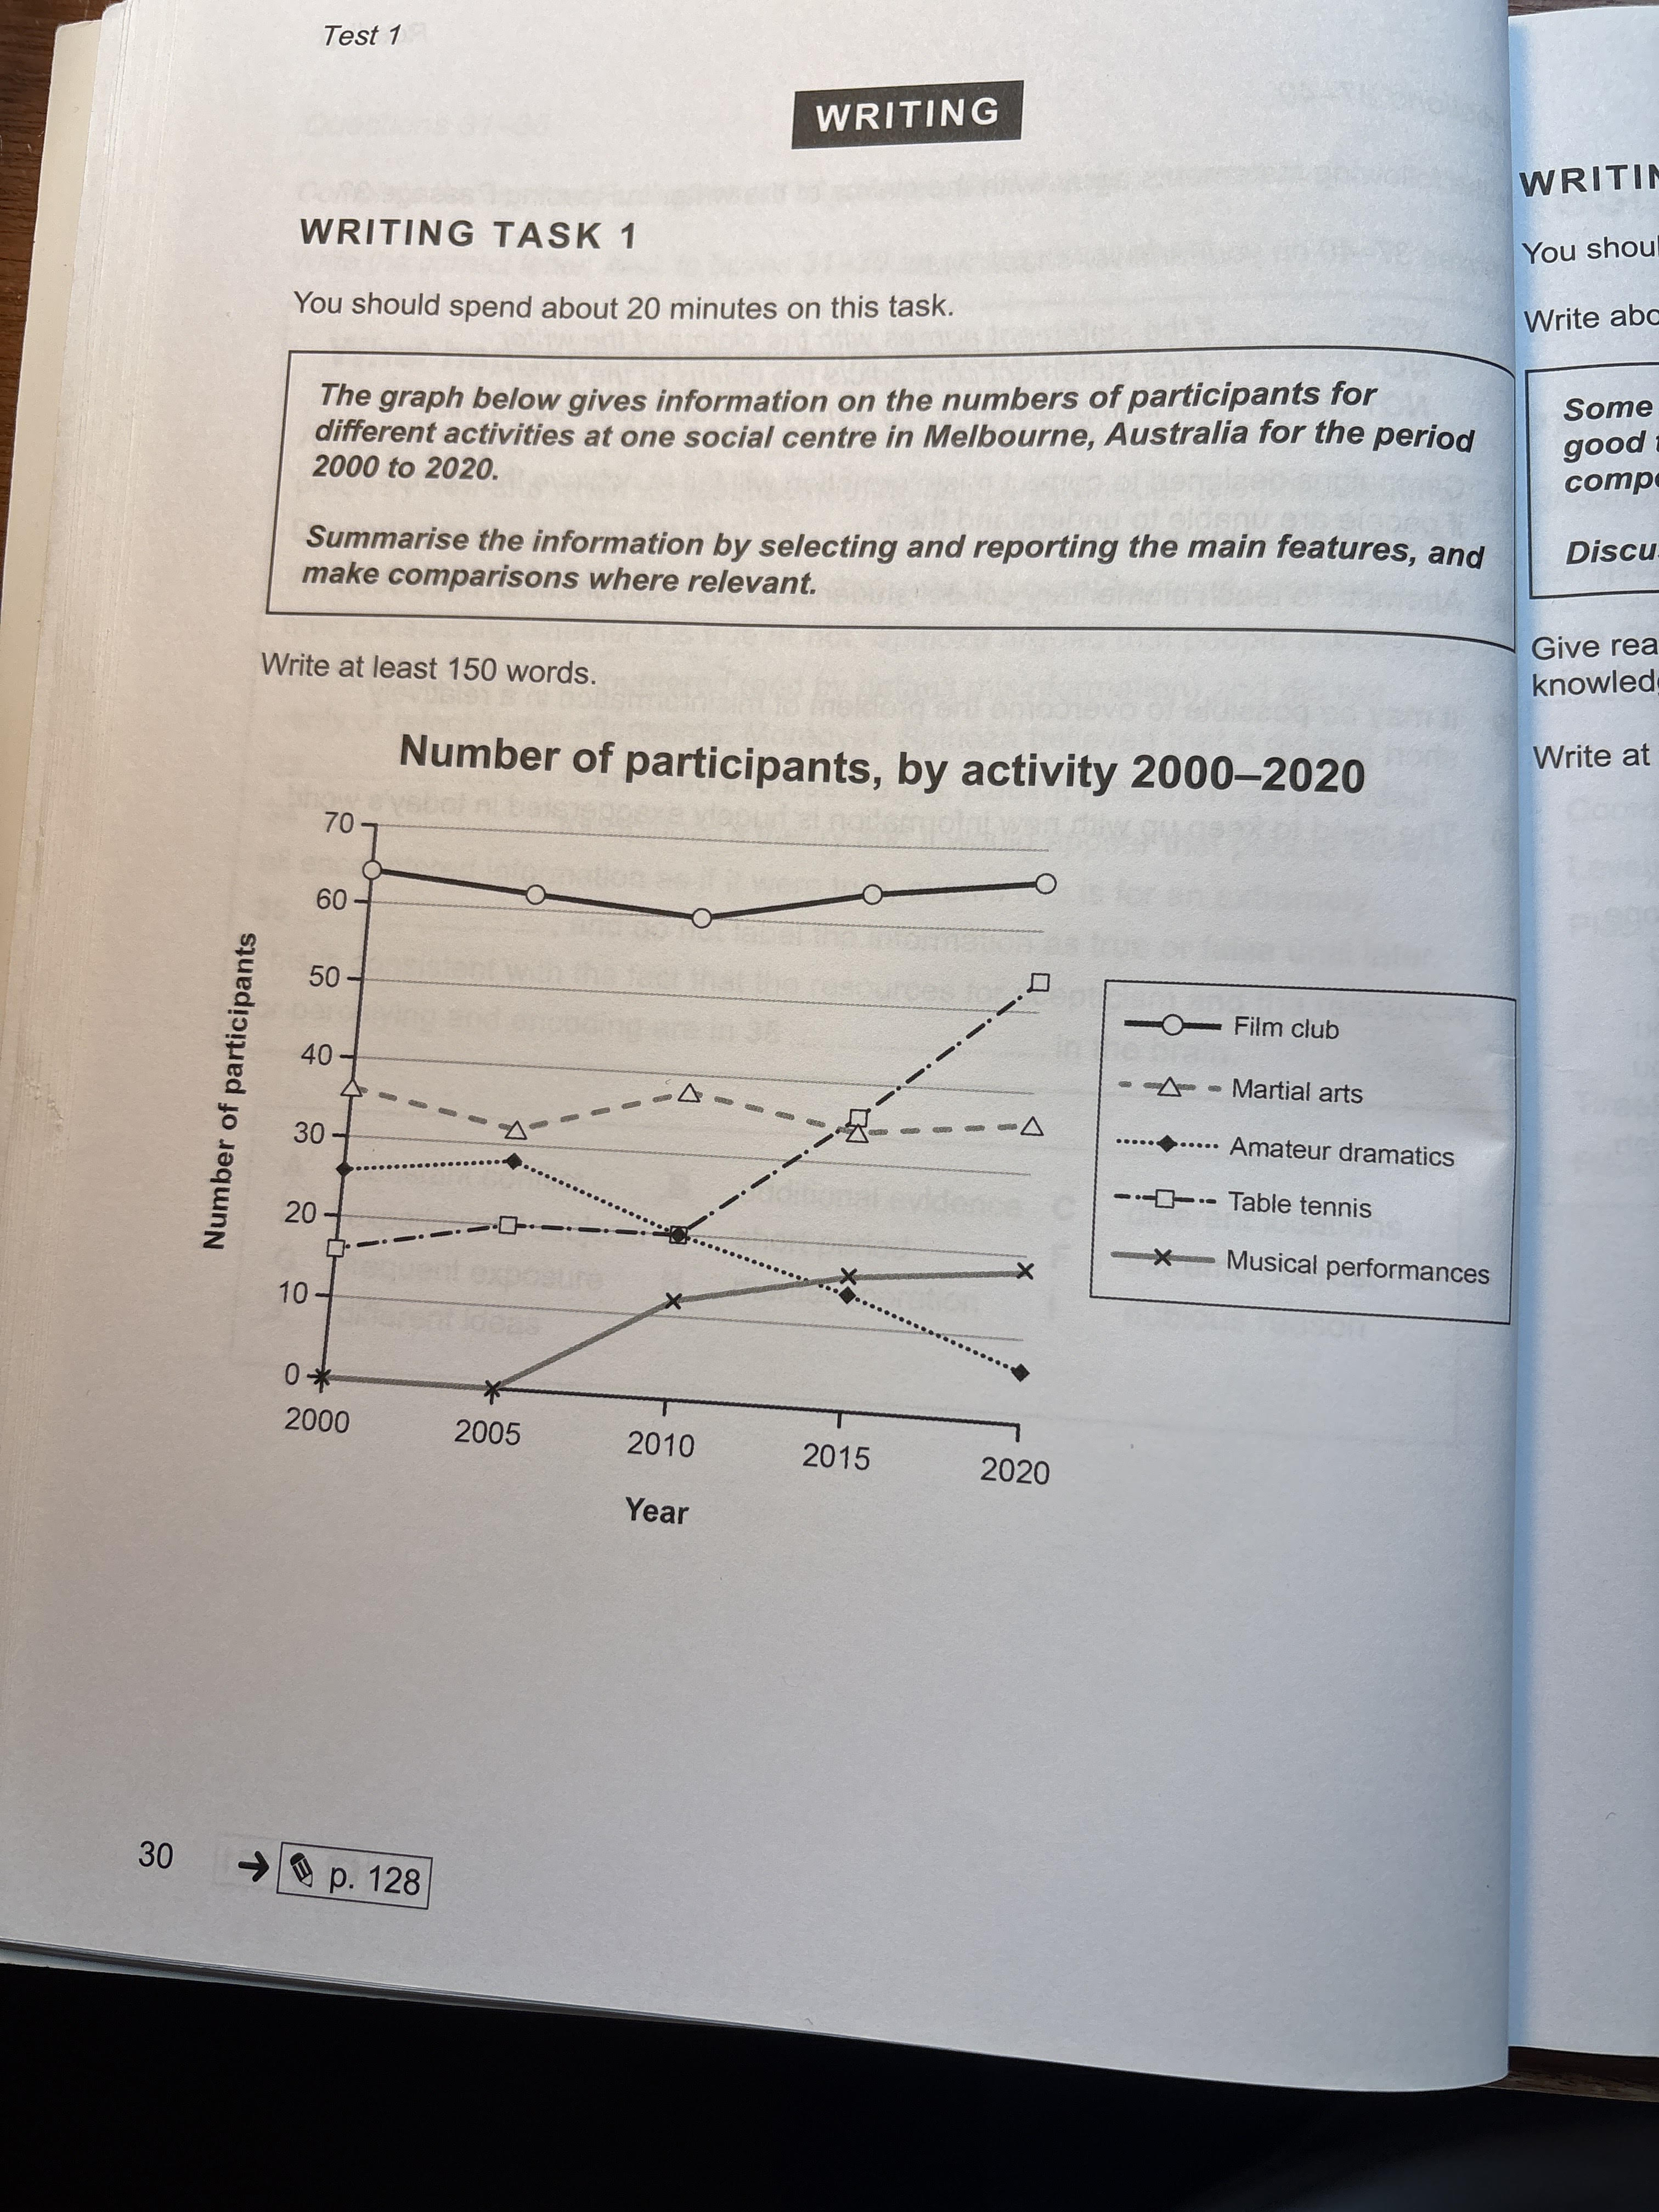
The chart presenting the number of the participants for five different activities at one social centre from 2000 to 2020 reveals the change in a popular thing throughout 20 years. Overall, it can be seen that Film club remain highest level for all of the periods. In contrast, the popularity of Amateur dramatics declined for five years since 2010. In right before 2015, the proportion of members who took part in Table tennis and Martial arts reached the same point at below 35. And then, the figure of Table tennis continued to grow and it also surged 20 to nearly 55 within 10 years actually. Moreover, in 2010, Amateur dramatics and Table tennis had the same score at 20. However, interests in Amateur dramatics decreased constantly, 20 and 10 in 2010 and 2020, respectively. The number of Musical performances joiners increased gradually from 0 to around 20 in the periods of 2005 to 2020.
Sample Detail
The graph below gives information on the numbers of participants for different activities at one social centre in Melbourne, Australia for the period 2000 to 2020. Summarise the information by selecting and reporting the main features, and make comparisons where relevant.
21/07/2026 06:36 5.5 points
Topic
The graph below gives information on the numbers of participants for different activities at one social centre in Melbourne, Australia for the period 2000 to 2020. Summarise the information by selecting and reporting the main features, and make comparisons where relevant.
Word count: 154
Chart/Graph
Essay
Overall Scores
5.5±0.5
Basic
Writing Criteria Scores
TA5.0
CC6.0
LR6.0
GRA6.0
Click on any highlighted text in the essay to view detailed suggestions for improvement.
Deep Analysis
Task 1 - Academic Writing
4 tools available
Sample Essay - IELTS Writing Task 1
No sample essay
Click the button below to analyze and generate a high-quality sample essay for Task 1.