
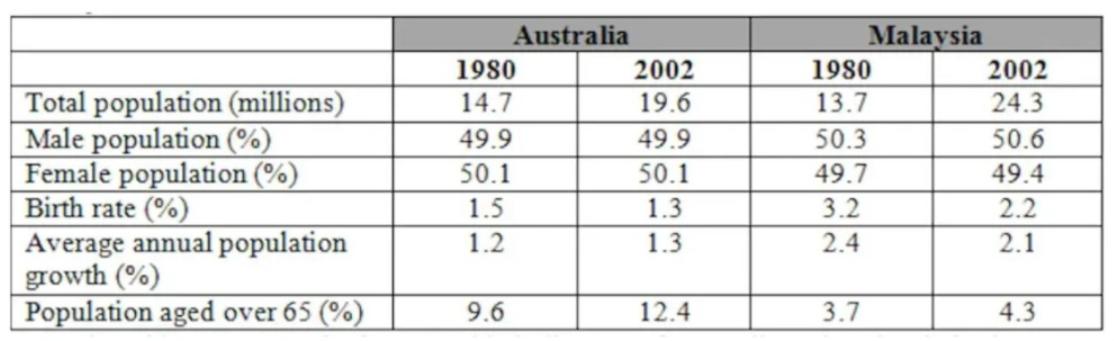
The diagram compares the population of Australia and Malaysia considering six different aspects ( total, gender, birth rate, average annual growth, aging population) between 1980 and 2002. Overall, the total number of Malaysians increased considerably, while Australian number experienced the slight growth. Furthermore, the aging population issue in Australia was much more serious than Malaysia. Regarding Australia, the total population went up from 14.7 to 19.6 millions, however, the gender proportion for both males and females stayed unchanged at 49.9% and 50.1% respectively. Meanwhile, there was the gradual decline in the birth rate by 0.2% which lead to the increase of population over 65 years old by 2.8%, the average annual population growth climbed to 1.3% in 2002. In Malaysia, the sum of population in 2002 at 24.3 millions was higher than mostly two times the one in 1980. In addition, the percentage of males grew by 0.3% compare to the decline of woman percentage by 0.7%. The birth rate saw the decrease from 3.2% to 2.2% causing two consequences are the downward of average annual population by 0.3% and the more serious aging issue.
Sample Detail
The table below gives information about population in Australia and Malaysia in 1980 and 2002.
21/07/2026 06:40 6.5 points
Topic
The table below gives information about population in Australia and Malaysia in 1980 and 2002.
Word count: 185
Chart/Graph
Essay
Overall Scores
6.5±0.5
Fair
Writing Criteria Scores
TA7.0
CC7.0
LR6.0
GRA6.0
Click on any highlighted text in the essay to view detailed suggestions for improvement.
Deep Analysis
Task 1 - Academic Writing
4 tools available
Sample Essay - IELTS Writing Task 1
No sample essay
Click the button below to analyze and generate a high-quality sample essay for Task 1.