
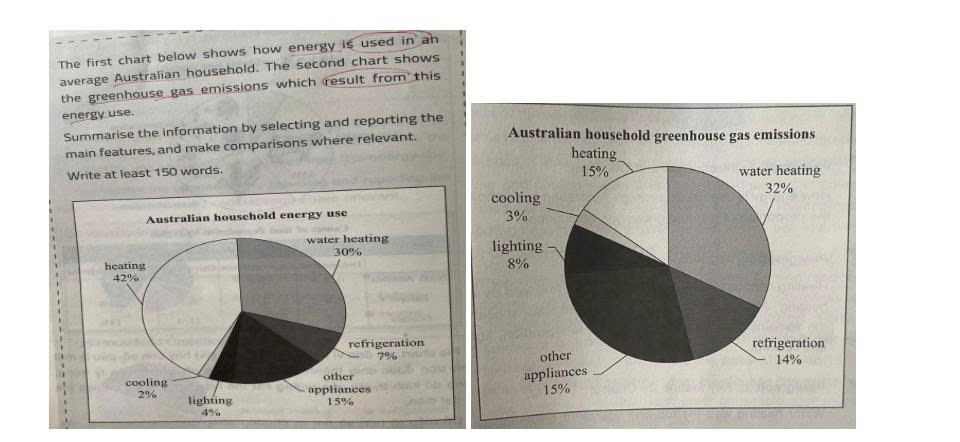
The inital graph depicts how power is consumed within a standard home in Australia, whereas the subsequent chart illustrates the resulting greenhouse gas emissions attributable to those energy demands. Overall, it is highly noticeable for the first chart that water heating and heating constitute the vast majority of the total energy consumption, while the top sources of greenhouse gas emissions are water heating and other appliances. Furthermore, cooling makes up the smallest percentage of energy use, consequently resulting in the lowest level of gas. Regarding the figure for the energy use in a Australian house, it is obvious that heating consumed the most, accounting for about 42 percent of the whole energy in comparison with 30% of water heating, which is two times as much as that of other appliances. Moreover, when it comes to energy groups that constitute in small amounts, including refrigeration and lighting with the proportion of 7%, 4% respectively. The appliance of cooling makes up the smallest part of energy at around 2%, being equivalent to one twentieth of that of heating. Looking at the details of the second chart, waterheating replaces heating in order to be the most popular energy impacting on greenhouse gas emissions at approximately 32%, followed by 28% of other appliances. In addition, the amount of the gas semissions released in the atmosphere due to the use of heating and refrigeration are mostly the same at roughly 15%. The influence of cooling and lighting on greenhouse gas emissions accounts for the smallest proportion of the whole source at about 3% and 8% respectively.
Detail Sampel
the first chart below shows how energy is used in an average Australian houshold. The second chart shows the green house gas emissions which result from this enery use
21/07/2026 06:55 7.5 skor
Topik
the first chart below shows how energy is used in an average Australian houshold. The second chart shows the green house gas emissions which result from this enery use
Jumlah kata: 261
Grafik/Diagram
Essay
Skor Keseluruhan
7.5±0.5
Baik
Skor Kriteria Writing
TA8.0
CC8.0
LR7.0
GRA7.0
Klik teks yang ditandai di esai untuk melihat saran detail untuk peningkatan.
Analisis mendalam
Task 1 - Academic Writing
4 tools available
Esai contoh - IELTS Writing Task 1
Belum ada esai contoh
Silakan klik tombol di bawah untuk menganalisis dan membuat esai contoh berkualitas tinggi untuk Task 1.