
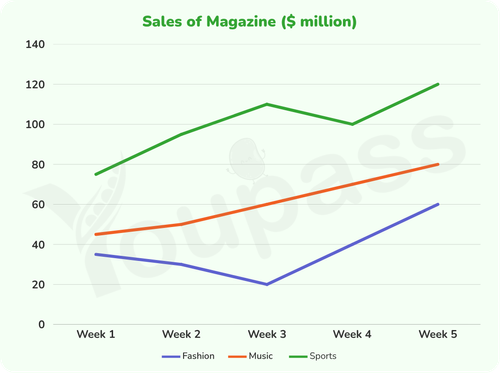
the given line graph illustrates sales of three categories of mangazines which include fashion,music,and sports in a particular area through 5 weeks, measured in million overall,the three figures increased throughout.while fashion and sports had some fluctuations over the period but music remained stable grown . in addition, sports held the leading positon from the beginning to the end when fashion witnessed an incredible change . specially, these three figures stayed at the similiar position in the final week like the ones in the first week regarding the one steady category.in the first week, music stood at around 45 millions then had a significant grown to 50 millions in week 2 before surged to 80 millions at the end, as well as almost doubled its initial figure , from around 45 millions to 80 millions,without many fluctuations. this is the stablest figure which rose steadily throughout and showed the lowest change in terms of the two remaining figure. sports held the leading position which accounted for under 80 millions in week 1 then it reached the significant height at around 115 millions in week 3,as well as the highest position at that time before it recorded a small decline to 100 millions in week 4. at he end of the period, sports reached its peak at 120 millions, continued staying at the highest one.the fashion started at under 40 millions , nearly doubled ít figure at 20 millions at week 3 after the slightly decrease, then it went up markedly tp 6o millions at the end, with significant grown from 40 at the beginning to 60
Sample Detail
The chart below shows sales of three categories of magazines (fashion, music, and sports) in a particular region over five weeks. Summarise the information by selecting and reporting the main features, and make comparisons where relevant.
21/07/2026 07:03 5.5 points
Topic
The chart below shows sales of three categories of magazines (fashion, music, and sports) in a particular region over five weeks. Summarise the information by selecting and reporting the main features, and make comparisons where relevant.
Word count: 265
Chart/Graph
Essay
Overall Scores
5.5±0.5
Basic
Writing Criteria Scores
TA6.0
CC6.0
LR5.0
GRA5.0
Click on any highlighted text in the essay to view detailed suggestions for improvement.
Deep Analysis
Task 1 - Academic Writing
4 tools available
Sample Essay - IELTS Writing Task 1
No sample essay
Click the button below to analyze and generate a high-quality sample essay for Task 1.