
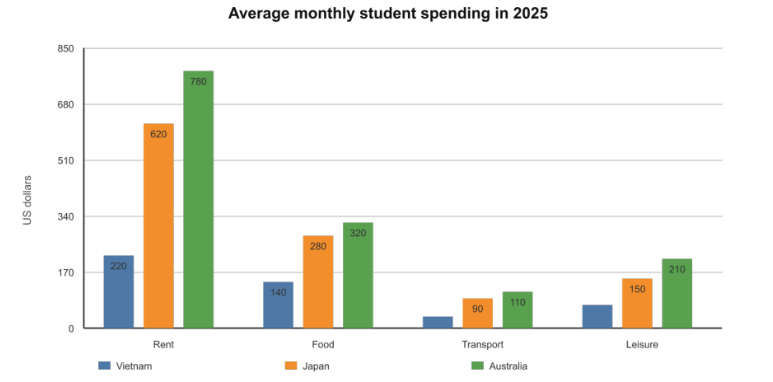
The given chart illustrates the mean of and distribution of student’s monthly payment across 4 categories in 3 nations in 2025. Overall, there is a similarity in how much money students spend on different purposes, Vietnamese always spend least, followed by Japanese and the Australian students have to pay the most. It is easy to see that, renting takes the most of students expenditure in all 3 countries. To begin with, housing is the most expensive payment that the students have to deal with, which costs Australian 780 dollars a month, 620 dollars monthly for Japanese while the Vietnamese just need to pay around one third of this amount of money. In addition, even though food is the second majority in student spending, the amount of money they need to pay just around half of the figure for renting as students in Australia, Japan and Vietnam pay 320, 280 and 140$ monthy for food. Because transportation is much cheaper so students just need to pay one third of the amount that they spend on food monthly. Likewise, comparing with the monthly spending on transport, they just spend more by 50 to 100 dollars on leisure.
Detail Sampel
The bar chart shows average monthly spending by students in three countries in 2025.
21/07/2026 07:11 6.0 skor
Topik
The bar chart shows average monthly spending by students in three countries in 2025.
Jumlah kata: 195
Grafik/Diagram
Essay
Skor Keseluruhan
6.0±0.5
Cukup
Skor Kriteria Writing
TA6.0
CC6.0
LR6.0
GRA6.0
Klik teks yang ditandai di esai untuk melihat saran detail untuk peningkatan.
Analisis mendalam
Task 1 - Academic Writing
4 tools available
Esai contoh - IELTS Writing Task 1
Belum ada esai contoh
Silakan klik tombol di bawah untuk menganalisis dan membuat esai contoh berkualitas tinggi untuk Task 1.