
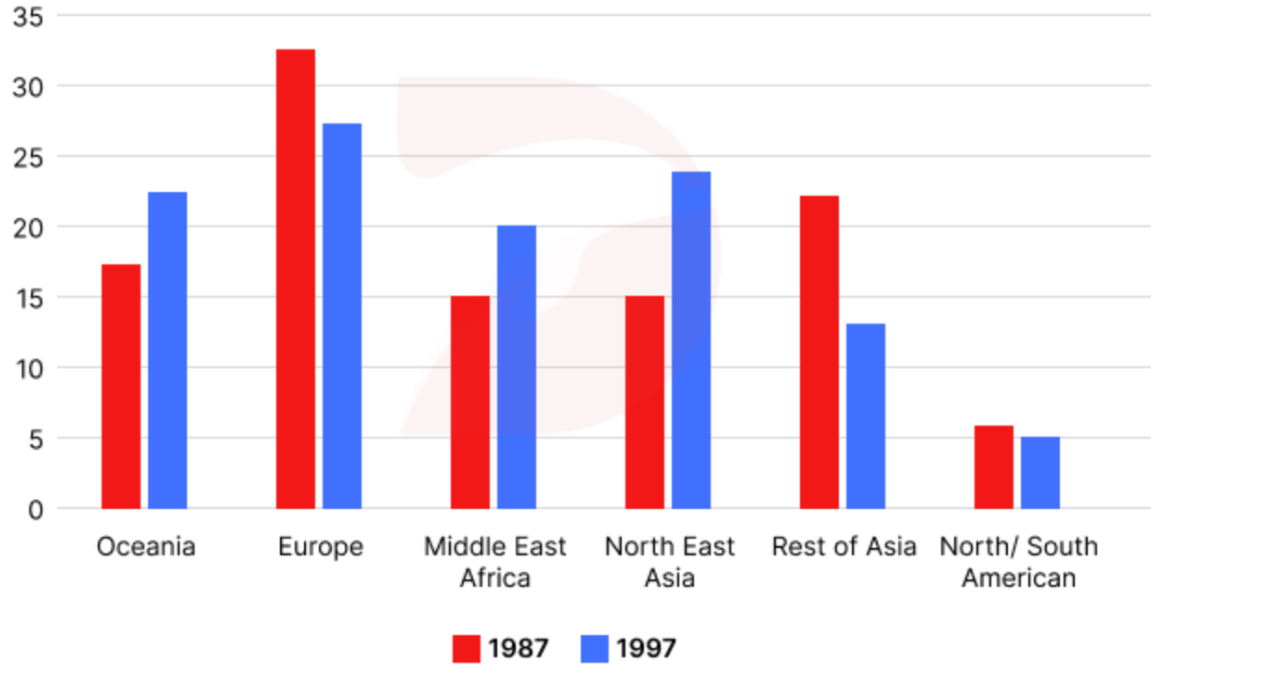
The bar chart presents information on the regional origins of individuals who migrated to Australia in 1987 and 1997. Overall, Europe remained the largest source of migrants despite a noticeable decline. In addition, migrants from Oceania, the Middle East Africa and the North East Asia generally rose, while those from the remaining countries fell, with individuals from North and South America consistently making up the smallest percentage. In 1987, newcomers from Oceanis constituted around 17%. This was followed by an equal share of the Middle East Africa and the North East Asia, standing at exactly 15%. By 1997, Oceania and the Middle East/Africa had risen to 22% and 20%, respectively. Similarly, North East Asia witnessed the most dramatic growth, reaching nearly 25% by the end. In contrast, the number of migrants from the remaining regions tended to decrease. Having declined sharply to 27% in 1997, Europe remained the largest source of migrants. The same pattern could be seen in the percentage of migrants from the rest of Asia, decreasing from 22% to 14% after 10 years. Particularly, the combined figure for North and South America was minimal, at around 6%.
Sample Detail
The chart below shows where migrants to Australia came from by region, in 1987 and 1997.
21/07/2026 07:12 7.5 points
Topic
The chart below shows where migrants to Australia came from by region, in 1987 and 1997.
Word count: 190
Chart/Graph
Essay
Overall Scores
7.5±0.5
Good
Writing Criteria Scores
TA8.0
CC8.0
LR7.0
GRA7.0
Click on any highlighted text in the essay to view detailed suggestions for improvement.
Deep Analysis
Task 1 - Academic Writing
4 tools available
Sample Essay - IELTS Writing Task 1
No sample essay
Click the button below to analyze and generate a high-quality sample essay for Task 1.