
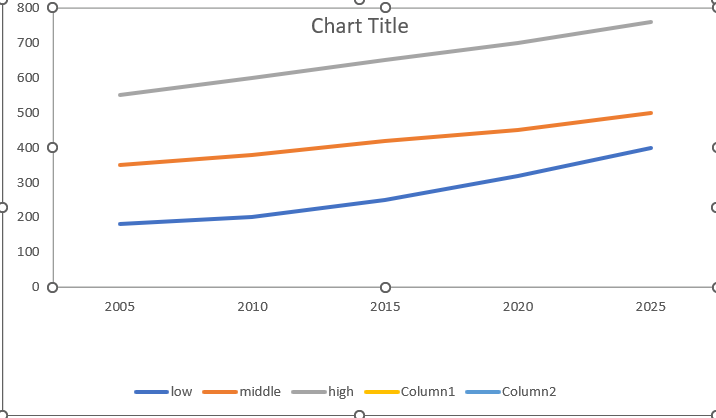
The line chart illustrated the average montly spending on food of three income groups including low-, middle-, high-income in Canada between 2005 and 2025 Overall, it is clear that spending on food by three income classes showed an upward trend. The high-income consistenly spent the top and low-income gave the least figure. In addition, the low-income increased significant the most in three income groups. The high-income spent approximately $550 on food in 2005, it continued to rose steadily to 600 in 2010, and 650, 700 in 2015, 2020, respectively. After that, high income increased shardly to 760 in the final year, the highest figure in the chart. Middle income group also follow a following a steady upward trend. In the first year, the average montly spending on food of middle-income was moderate, approx 350, and climbed gradually to 380 in 2010 and then to 420 in 2015. After just 10 years, it increased to 500 in the final year In terms of low-income, the average montly spending on food was at lowest level. In 2005, it only spent about 180 and increased from 200 in 2010 to 250 in 2015 and continued to rose to 320, 400 in 2020 and 2025, respectively. However, low-income increased experienced growth faster than the other two
Detail Sampel
The graph below shows the average monthly spending on food by three income groups in Canada from 2005 to 2025. Summarise the information by selecting and reporting the main features, and make comparisons where relevant
21/07/2026 07:44 6.5 skor
Topik
The graph below shows the average monthly spending on food by three income groups in Canada from 2005 to 2025. Summarise the information by selecting and reporting the main features, and make comparisons where relevant
Jumlah kata: 212
Grafik/Diagram
Essay
Skor Keseluruhan
6.5±0.5
Cukup
Skor Kriteria Writing
TA7.0
CC7.0
LR6.0
GRA6.0
Klik teks yang ditandai di esai untuk melihat saran detail untuk peningkatan.
Analisis mendalam
Task 1 - Academic Writing
4 tools available
Esai contoh - IELTS Writing Task 1
Belum ada esai contoh
Silakan klik tombol di bawah untuk menganalisis dan membuat esai contoh berkualitas tinggi untuk Task 1.