
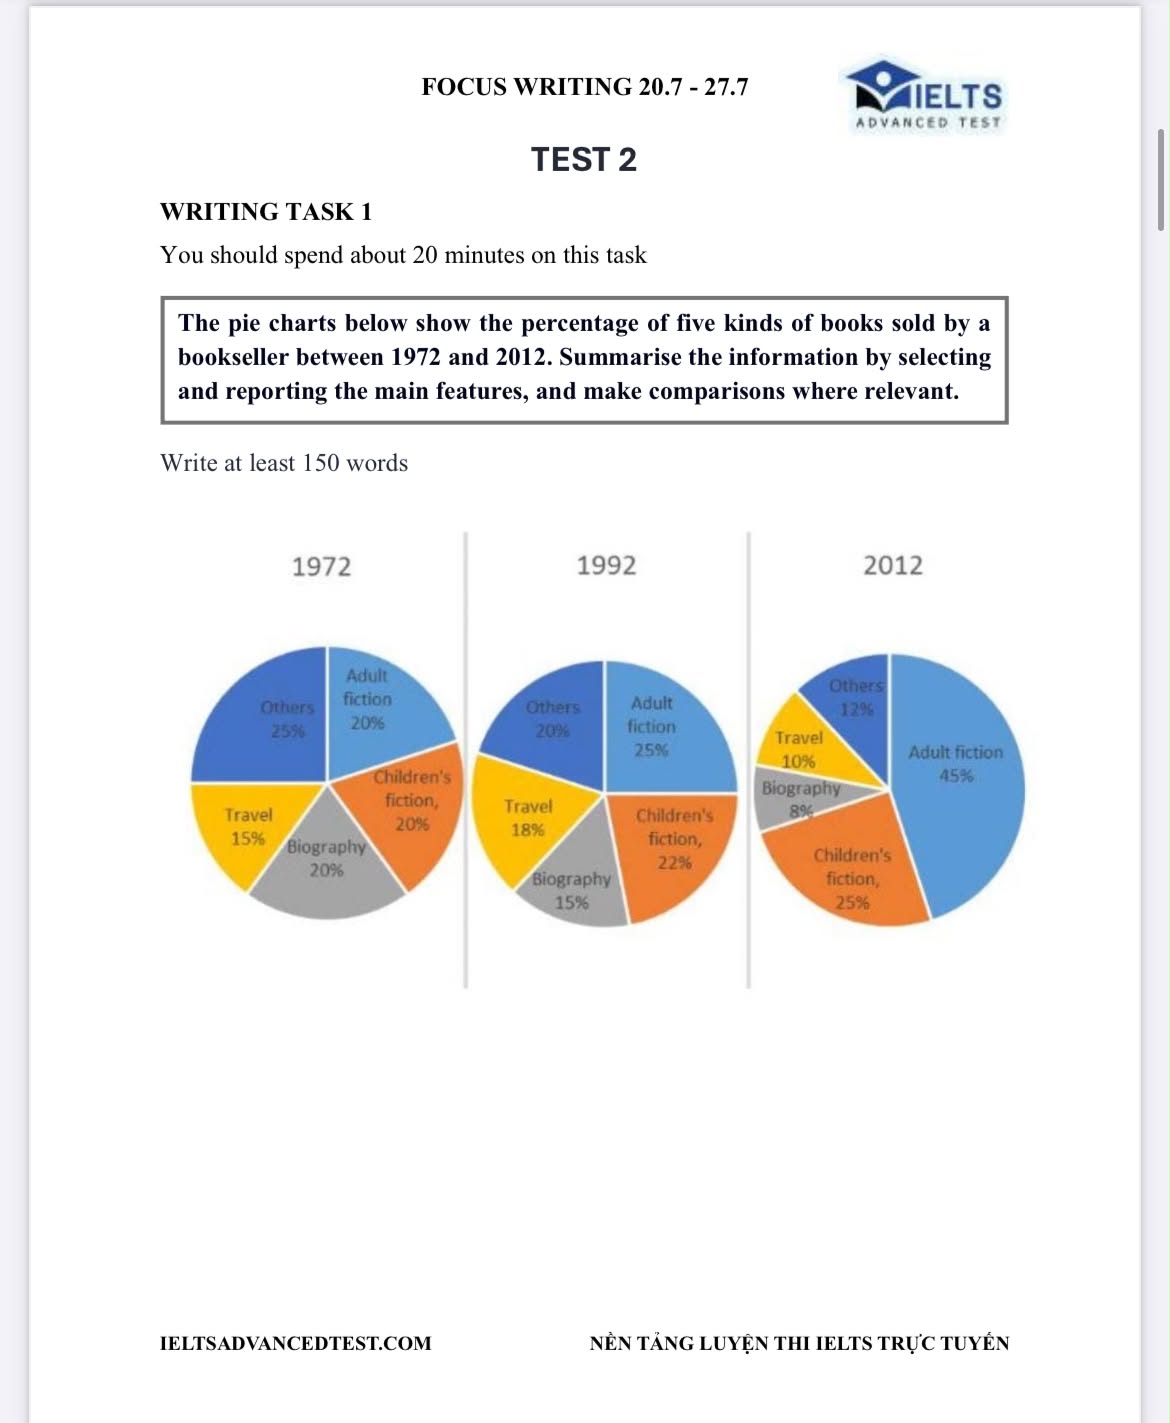
The pie charts illustrate the proportion of five types of books sold by booksellers from 1972 to 2012. Overall, the Adult fiction and Children’s fiction figure witnessed an increase throughout the years, while that of Biography and others displayed an opposite trend. Another noticeable thing was Travel increased slightly before dropping in the final stage. Regarding the data in 1972, Children’s fiction accounted for 20% which was shared the second-highest position with Biography and Adult fiction, this figure increased slightly to 22% in 1992 and ending at 25% in 2012, which was followed by Adult fiction, from 20% to 25% in 1992 and reached to 45% and dominated the whole proportion in 2012. In contrast, the figures for Biography and Others witnessed a significant decline over the period, stood at 20% and 25% and started to drop to 15% and 20% in 1992 and 8% and 12% in 2012 respectively. Furthermore, although Travel had a slight climb up from 15% to 18% in 1992, Travel’s figure decreased to 10% in the final year.
Sample Detail
Trong ảnh
21/07/2026 07:49 6.5 points
Topic
Trong ảnh
Word count: 173
Chart/Graph
Essay
Overall Scores
6.5±0.5
Fair
Writing Criteria Scores
TA7.0
CC7.0
LR7.0
GRA6.0
Click on any highlighted text in the essay to view detailed suggestions for improvement.
Deep Analysis
Task 1 - Academic Writing
4 tools available
Sample Essay - IELTS Writing Task 1
No sample essay
Click the button below to analyze and generate a high-quality sample essay for Task 1.