
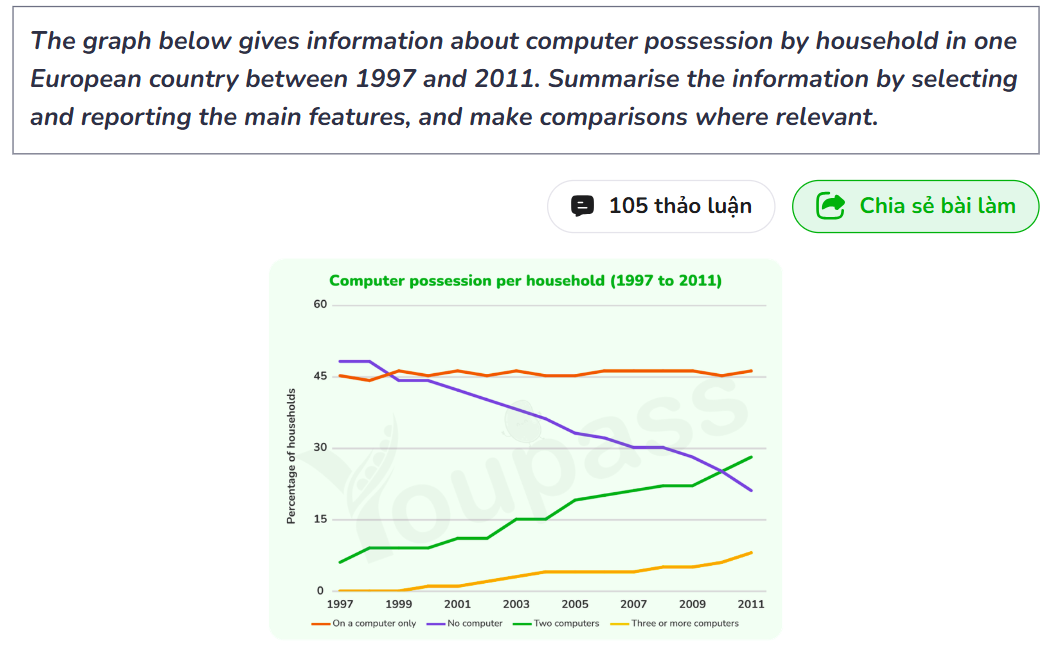
The line chart illustrates the proportion of computer possession by household in a particular European nation from 1997 to 2011. Overall, the percentage of individuals owning a computer was the most leading category throughout the period. Notably, despite starting a dominant point in the initial year, the figure for having no computer experienced a remarkable reduction while the percentage of those possessing two computers and three or more ones were increased significantly. The percentage of users having no computer led the possession group at the beginning of the period, accounting for 49%. The figure then witnessed a considerable decline to reach 30% in 2007 and its level continued stable in a following year. From 2008 onwards, the figure for individuals having no computer decreased further to reach a low point of approximately 24% by 2011. Additionally, the proportion of users having one computer started at around 47% after which it observed a slight fluctuation and then the figure maintained its increased rate to end at around 46%, becoming the most dominate figure across other categories. Regarding the remaining categories, the proportion of people having two computers began at nearly 10% in 1997 before the figure witnessed a modest increase to reach 15% in 2004. The figure further continued to rise to reach roughly 25% in the final year. A similar trend can be seen in the percentage of people having three or more computers, ranging from zero% to nearly 12% in 1997 and in 2011, respectively.
รายละเอียดตัวอย่าง
The graph below gives information about computer possession by household in one European country between 1997 and 2011. Summarise the information by selecting and reporting the main features, and make comparisons where relevant.
21/07/2026 09:37 7.0 คะแนน
หัวข้อ
The graph below gives information about computer possession by household in one European country between 1997 and 2011. Summarise the information by selecting and reporting the main features, and make comparisons where relevant.
จำนวนคำ: 246
แผนภูมิ/กราฟ
Essay
คะแนนรวม
7.0±0.5
ดีมาก
คะแนนเกณฑ์การเขียน
TA7.0
CC7.0
LR7.0
GRA7.0
คลิกข้อความที่ไฮไลต์ในเรียงความเพื่อดูคำแนะนำรายละเอียดเพื่อพัฒนา
การวิเคราะห์เชิงลึก
Task 1 - Academic Writing
4 tools available
บทความตัวอย่าง - IELTS Writing Task 1
ยังไม่มีบทความตัวอย่าง
กดปุ่มด้านล่างเพื่อวิเคราะห์และสร้างบทความตัวอย่างคุณภาพสูงสำหรับ Task 1