
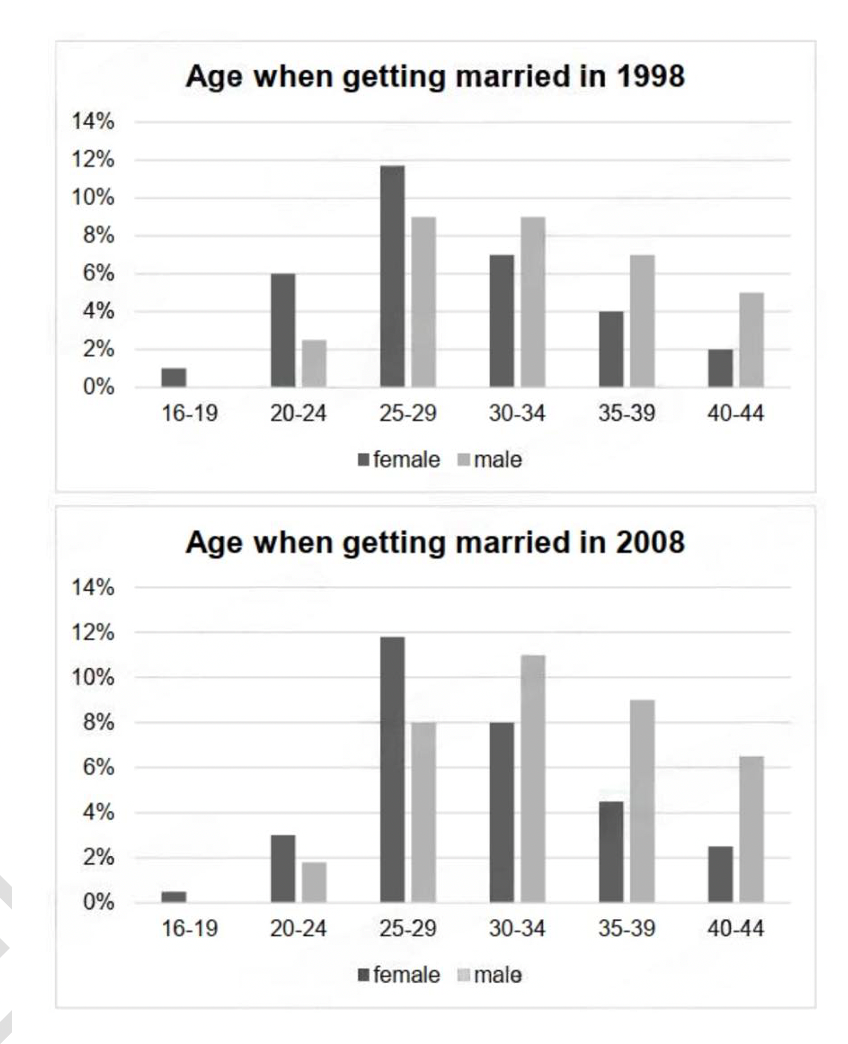
The chart compares the age gap between males and females who got married from 1998 to 2008. Overall, both genders were likely to postpone marriage until older age, while women had tendency to marry at an earlier stage. Beside that, the rate of marriage between 25-29 was highest over the period Looking to the males’ status, married men aged 30-34 made up 11% in two years surveyed, representing the dominant age group. Followed by the 25-29 years-old in 1998, accounting for 9%, but in 2008, the figure was replaced by the 35-39 people. Notably, there was no recored signal of marriage for males at the ages of 16-19. The average percentage of older adults also experienced an upward trend. Regarding the remaining group, which showed a similar pattern to the men’s category. The proportion of people who got married at the ages 20-30 saw a significant rise, the most remarkable of which was 25-29 bracket, peaking at 12%. Before 30s, the marital status declined year by year. Meanwhile, the figure for 40s was equal to 20-25, merely 2,5%.
Detail Sampel
The bar chart shows the age when getting married in 1998 and 2008
21/07/2026 09:47 6.0 skor
Topik
The bar chart shows the age when getting married in 1998 and 2008
Jumlah kata: 178
Grafik/Diagram
Essay
Skor Keseluruhan
6.0±0.5
Cukup
Skor Kriteria Writing
TA6.0
CC6.0
LR6.0
GRA6.0
Klik teks yang ditandai di esai untuk melihat saran detail untuk peningkatan.
Analisis mendalam
Task 1 - Academic Writing
4 tools available
Esai contoh - IELTS Writing Task 1
Belum ada esai contoh
Silakan klik tombol di bawah untuk menganalisis dan membuat esai contoh berkualitas tinggi untuk Task 1.