
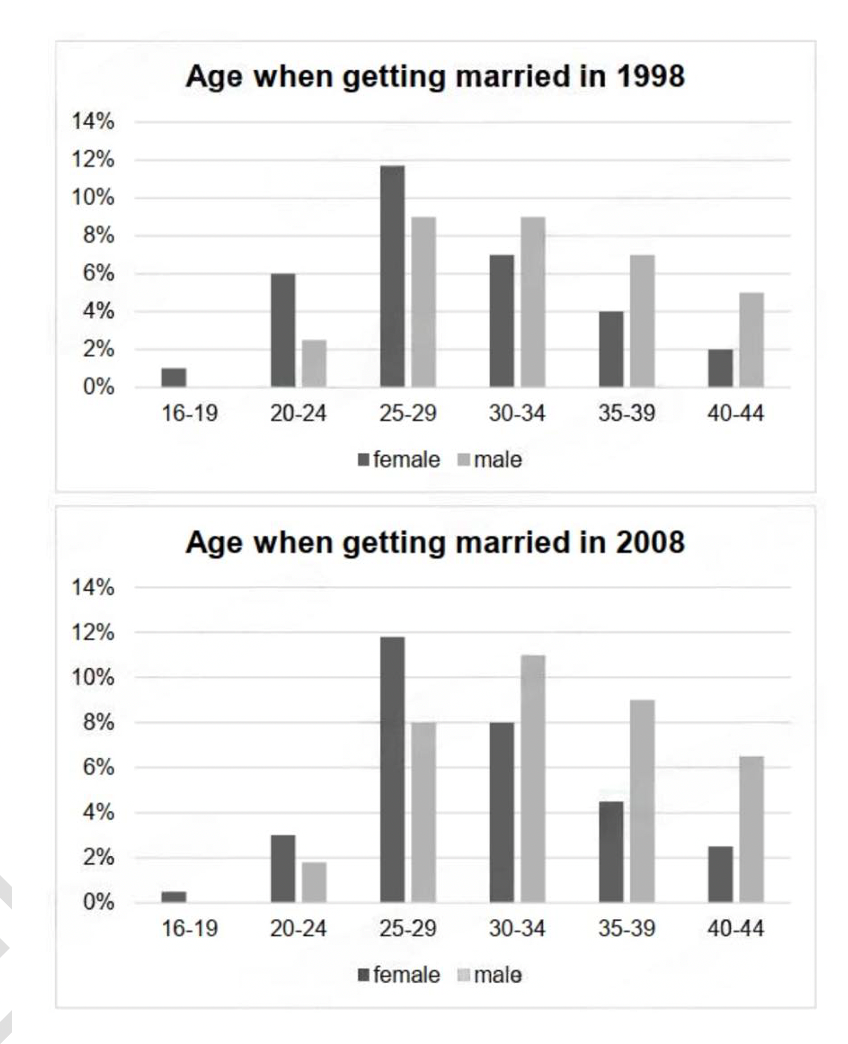
The chart compares the age gap between males and females who got married from 1998 to 2008. Overall, both genders were likely to postpone marriage until older age, while women had tendency to marry at an earlier stage. Beside that, the rate of marriage between 25-29 was highest over the period Looking to the males’ status, married men aged 30-34 made up 11% in two years surveyed, representing the dominant age group. Followed by the 25-29 years-old in 1998, accounting for 9%, but in 2008, the figure was replaced by the 35-39 people. Notably, there was no recored signal of marriage for males at the ages of 16-19. The average percentage of older adults also experienced an upward trend. Regarding the remaining group, which showed a similar pattern to the men’s category. The proportion of people who got married at the ages 20-30 saw a significant rise, the most remarkable of which was 25-29 bracket, peaking at 12%. Before 30s, the marital status declined year by year. Meanwhile, the figure for 40s was equal to 20-25, merely 2,5%.
รายละเอียดตัวอย่าง
The bar chart shows the age when getting married in 1998 and 2008
21/07/2026 09:47 6.0 คะแนน
หัวข้อ
The bar chart shows the age when getting married in 1998 and 2008
จำนวนคำ: 178
แผนภูมิ/กราฟ
Essay
คะแนนรวม
6.0±0.5
ดีพอใช้
คะแนนเกณฑ์การเขียน
TA6.0
CC6.0
LR6.0
GRA6.0
คลิกข้อความที่ไฮไลต์ในเรียงความเพื่อดูคำแนะนำรายละเอียดเพื่อพัฒนา
การวิเคราะห์เชิงลึก
Task 1 - Academic Writing
4 tools available
บทความตัวอย่าง - IELTS Writing Task 1
ยังไม่มีบทความตัวอย่าง
กดปุ่มด้านล่างเพื่อวิเคราะห์และสร้างบทความตัวอย่างคุณภาพสูงสำหรับ Task 1