
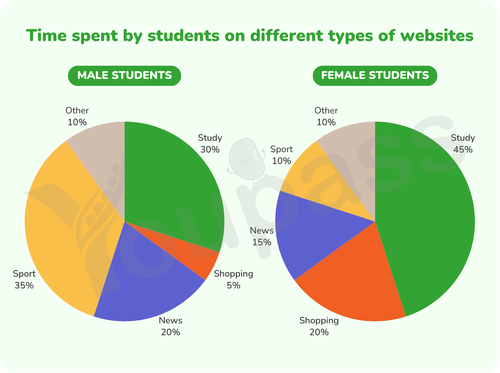
The two pie charts compare the proportion of time spent on five distinct types of websites based on gender. From a quick glance, it is clear that male students spend almost their time on sport, while female students are study websites. Notably, both genders allocate the identical amount of time to looking at other websites. Regarding the website that have a higher male readership, standing at 35%, the figure for sport of boy students dominate the overall utilization among the mentioned websites, being three times as high as the statistics for that of girl students, at only 10%. Followed by news, the percentage of men are 20%, while that of women are 5% lower. Turning to the remaining websites that recording the converserly trend, standing at approximately a quarter, the proportion of time spent on shopping by girls dominate the overall utilization among the mentioned websites, being four times as high as the statistics for that of boys. The percentage of time allocate for study of males and females are 30% and 45%, respectively. In fact, both genders devote the same amount of time to viewing other websites, at only 10%.
รายละเอียดตัวอย่าง
The charts below illustrate the percentage of time that male and female students spend on five different types of websites. Summarise the information by selecting and reporting the main features, and make comparisons where relevant.
21/07/2026 09:55 6.0 คะแนน
หัวข้อ
The charts below illustrate the percentage of time that male and female students spend on five different types of websites. Summarise the information by selecting and reporting the main features, and make comparisons where relevant.
จำนวนคำ: 191
แผนภูมิ/กราฟ
Essay
คะแนนรวม
6.0±0.5
ดีพอใช้
คะแนนเกณฑ์การเขียน
TA6.0
CC6.0
LR6.0
GRA6.0
คลิกข้อความที่ไฮไลต์ในเรียงความเพื่อดูคำแนะนำรายละเอียดเพื่อพัฒนา
การวิเคราะห์เชิงลึก
Task 1 - Academic Writing
4 tools available
บทความตัวอย่าง - IELTS Writing Task 1
ยังไม่มีบทความตัวอย่าง
กดปุ่มด้านล่างเพื่อวิเคราะห์และสร้างบทความตัวอย่างคุณภาพสูงสำหรับ Task 1