
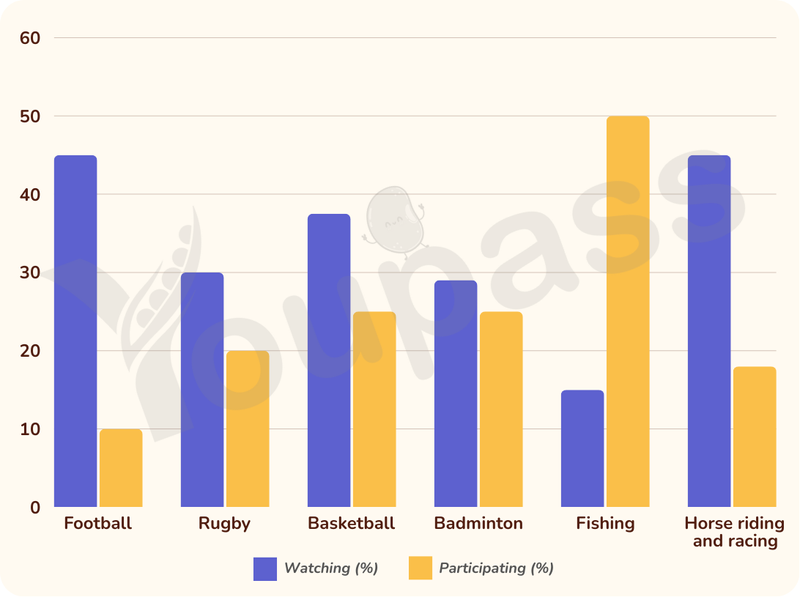
The chart depicts the proportion of men aged 16 to 25 in a specific nation who have preference for spectating sports rather than taking part in them. Overall, it is clear that the percentage of males watching sports was more than participating, except fishing. Football and horse riding and racing were the highest percentage of watching while fishing was the largest number of males who prefer participating. In terms of viewing figures, football and horse riding and racing were the most popular, both peaking at around 45%. Basketball followed with approximately 38% of spectators. Rugby and badminton were watched by around 30% and 28% respectively, while fishing had the lowest figure at roughly 15%. Regarding participating in sports, fishing remained at 50% which is the highest percentage. The proportions who actually took part were low, as only 10% of males played football and just 18% engaged in horse riding and racing. Rugby, basketball and badminton were took part in by approximately 30%, 38% and 28% respectively.
नमूना विवरण
The graph shows the percentage of males aged 16-25 in a particular country who prefer watching sports to males who prefer participating in sports. Summarise the information by selecting and reporting the main features and make comparisons where relevant.
21/07/2026 10:02 7.0 अंक
विषय
The graph shows the percentage of males aged 16-25 in a particular country who prefer watching sports to males who prefer participating in sports. Summarise the information by selecting and reporting the main features and make comparisons where relevant.
शब्दों की संख्या: 166
चार्ट/ग्राफ
Essay
समग्र स्कोर
7.0±0.5
अच्छा
राइटिंग मानदंड स्कोर
TA7.0
CC7.0
LR7.0
GRA7.0
सुधार के विस्तृत सुझाव देखने के लिए लेख में किसी भी हाइलाइट किए गए टेक्स्ट पर क्लिक करें।
गहन विश्लेषण
Task 1 - Academic Writing
4 उपकरण उपलब्ध
नमूना लेख - IELTS Writing Task 1
कोई नमूना लेख नहीं
Task 1 के लिए उच्च-गुणवत्ता वाला नमूना लेख विश्लेषण और बनाने के लिए नीचे दिए गए बटन पर क्लिक करें।