
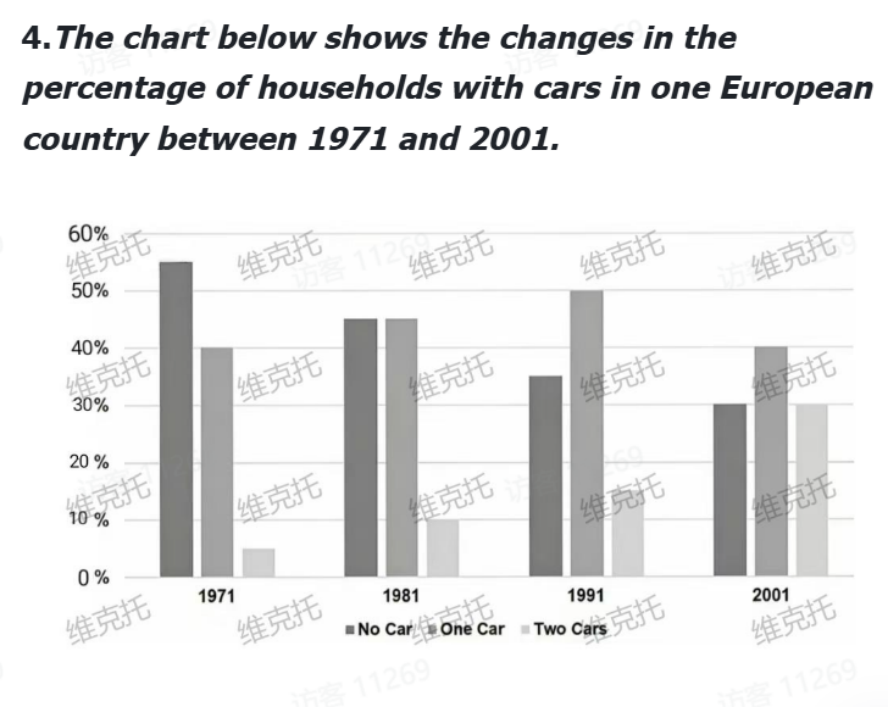
The bar chart illustrates the changes in the proportion of families with cars in a certain European country from 1971 to 2001. Overall, the proportions of three categories (no cars, one car and two cars) were seen to evenly distributed in 2001. Meanwhile, the majority of households did not have cars in 1971, but in 2001, ‘one car’ ranked first in comparison in 2001. Looking at ‘no car’ first, a downward trend was displayed. To be specific, households without cars dominated in 1971, reaching 55%. However, it then declined dramatically and was overtaken by ‘one car’ in 1991. Subsequently, it dropped to 30% in 2001, sharing the same figure as ‘two cars’. Turning to ‘one car’, a more volatile fluctuation was exhibited. Starting at 40%, the category had the second largest percentage in 1971. It then rose by 5% to share the same figure as ‘no car’ in 1981, followed by a stable growth to peak at 50% in 1991. Conversely, it fell to 40% in 2001, though the group was still the most prevalent one. Shifting to ‘two cars’, although the classification remained to record the lowest figure, a steady increase was presented. In 1971, people who owned two cars accounted for only 5%, which was approximately one fifth of that of ‘no car’. Nevertheless, it climbed moderately in the following two decades, with a remarkable surge to 30% eventually in 2001.
รายละเอียดตัวอย่าง
The chart below shows the changes in the percentage if households with cars in one European country between 1971 and 2001
21/07/2026 10:09 7.5 คะแนน
หัวข้อ
The chart below shows the changes in the percentage if households with cars in one European country between 1971 and 2001
จำนวนคำ: 233
แผนภูมิ/กราฟ
Essay
คะแนนรวม
7.5±0.5
ดีมาก
คะแนนเกณฑ์การเขียน
TA8.0
CC8.0
LR7.0
GRA7.0
คลิกข้อความที่ไฮไลต์ในเรียงความเพื่อดูคำแนะนำรายละเอียดเพื่อพัฒนา
การวิเคราะห์เชิงลึก
Task 1 - Academic Writing
4 tools available
บทความตัวอย่าง - IELTS Writing Task 1
ยังไม่มีบทความตัวอย่าง
กดปุ่มด้านล่างเพื่อวิเคราะห์และสร้างบทความตัวอย่างคุณภาพสูงสำหรับ Task 1