
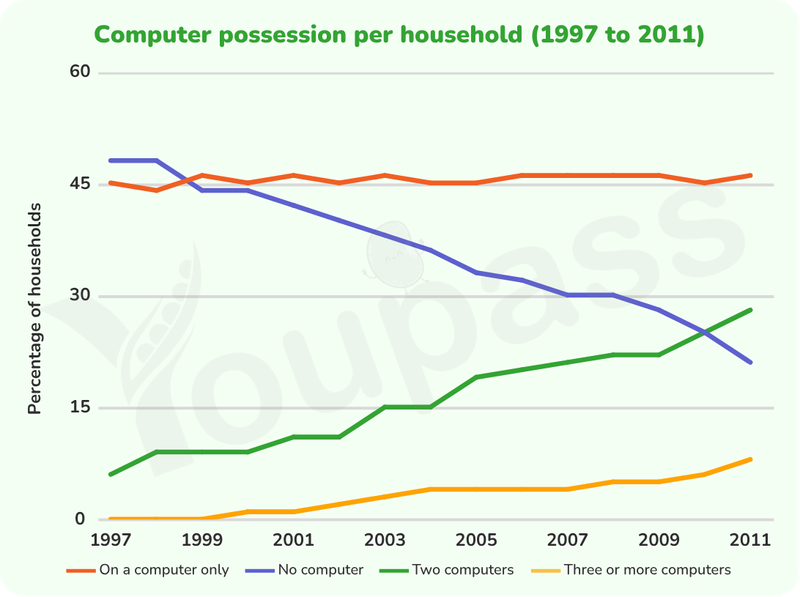
The line chart illustrates the proportions of household computer ownership in a country in Europe from 1997 to 2011. Overall, the percentages of households owning two or three or more computers followed an upward trend during the period, while the no-computer category showed the reverse trend. In addition, the figure for households with no computer accounting for the highest share in the early years, before ceding its dominance to the one-computer-only group. Regarding the two most common types of computer ownership, the no-computer category experienced a downturn, while the one-computer group documented an opposite trend. The figure for households owning no computer witnessed a subsequent decrease, declining from around 48% to 21% at the end of the period, albeit to staying constant in the 1997-1998 and 1999-2000 periods. In contrast, The proportion of households with one computer remained relatively stable throughout the period, with a minor increase from 45% to 46%. Concerning the remaining categories, upward trends were seen by both households with two computers and those having three or more computers. The two-computer group observed a significant rise, increasing from 6% to 28%, despite periods of stability. The figure for households owning three or more computers stayed at 0% in the initial phase of the period, before increasing consistenly to 8% in 2011. By comparison, after experiencing rises, the two-computer group became the second most popular type of computer ownership, whereas the three-or-more-computer remained the lowest.
নমুনা বিস্তারিত
The graph below gives information about computer possession by household in one European country between 1997 and 2011. Summarise the information by selecting and reporting the main features, and make comparisons where relevant.
21/07/2026 10:12 7.0 স্কোর
টপিক বা বিষয়
The graph below gives information about computer possession by household in one European country between 1997 and 2011. Summarise the information by selecting and reporting the main features, and make comparisons where relevant.
শব্দ সংখ্যা: 237
চার্ট/গ্রাফ
Essay
সামগ্রিক স্কোর
7.0±0.5
ভালো
রাইটিং মানদণ্ড স্কোর
TA7.0
CC7.0
LR7.0
GRA7.0
উন্নতির জন্য বিস্তারিত পরামর্শ দেখতে প্রবন্ধের হাইলাইট করা যেকোনো লেখায় ক্লিক করুন।
গভীর বিশ্লেষণ
Task 1 - Academic Writing
4 tools available
নমুনা রচনা - IELTS Writing Task 1
কোনো নমুনা রচনা নেই
টাস্ক ১-এর জন্য উচ্চমানের নমুনা রচনা বিশ্লেষণ এবং তৈরি করতে নিচের বাটনে ক্লিক করুন।