
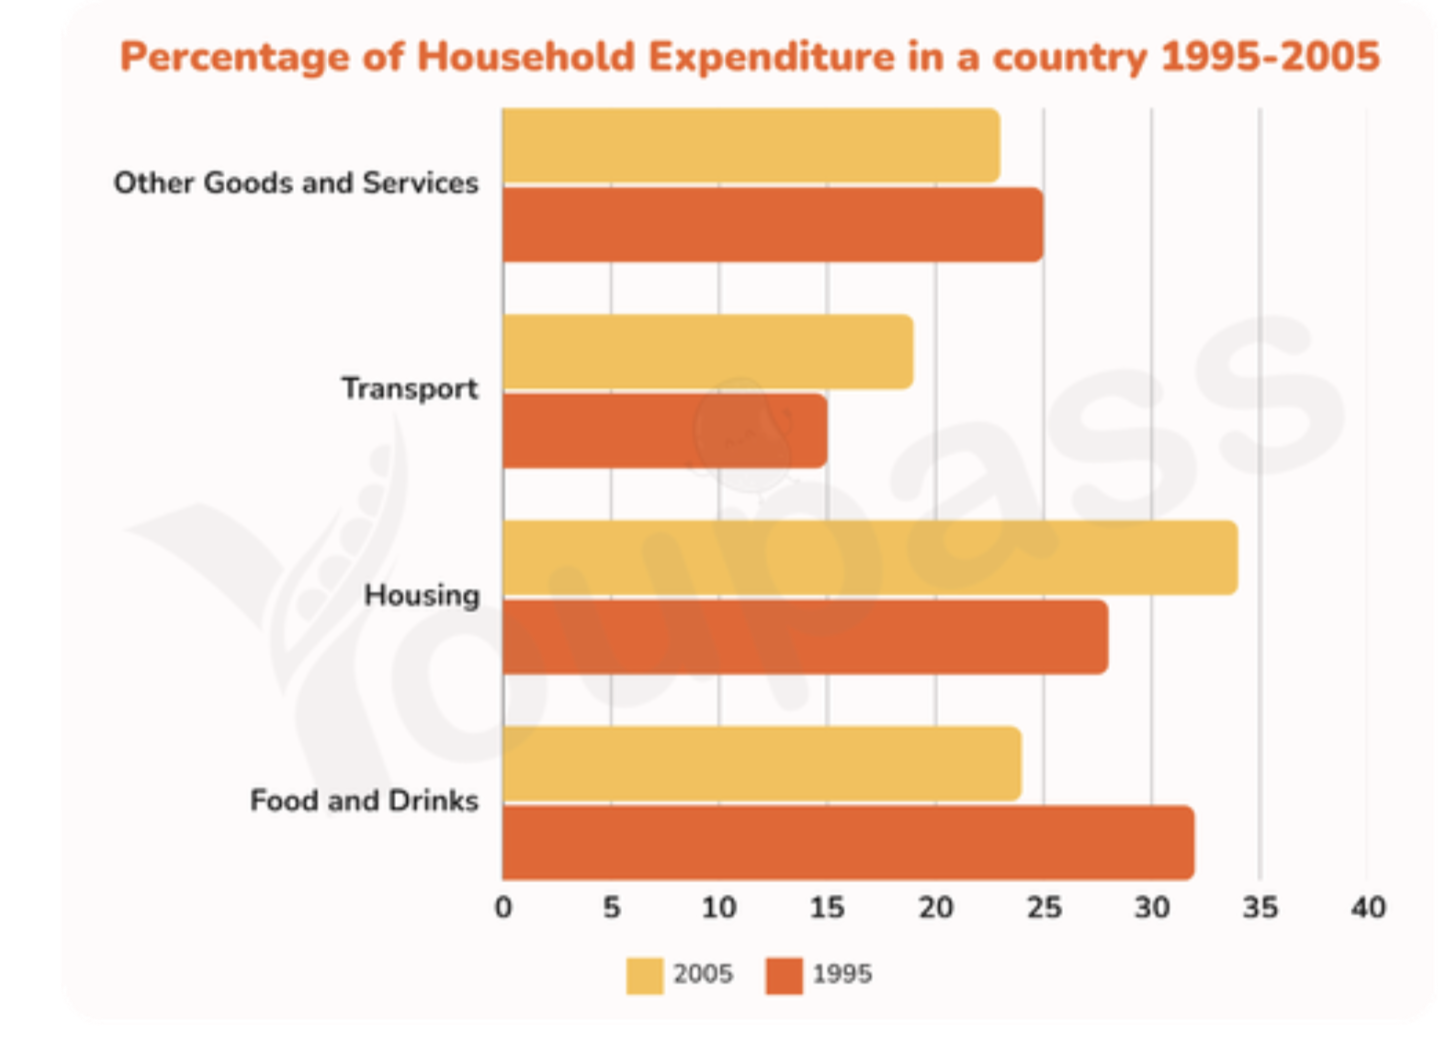
The given chart illustrates the proportion of household expenditure on goods and services in one country during a 10-year period from 1995 to 2005. Overall, it is obvious that the figures for household expenditure on housing and food and drinks experienced top of the list once, while the opposite was true for transport and other goods and services throughout the period. Looking more closely at the given chart, the percentage of household expenditure on food and drinks decreased significantly from around 32% in 1995 to nearly 25% in 2005. Nevertheless, the figures for household expenditure on housing witnessed a sharply growth from approximately 27% at the beginning of the period to nearly 35% at the end of the years. Regarding to the two remaining fields, the proportion of household expenditure on transport and other goods and services have a huge difference. The figures for household expenditure on other goods and services dropped gradually from 25% in 1995 to just around 23% at the end of the period. However, the percentage of household expenditure on transport declined quickly from 15% at the beginning of the years to nearly 20% at the end of the period
Sample Detail
The chart shows the percentage of household expenditure on goods and services in a country from 1995 to 2005. Summarise the information by selecting and reporting the main features and make comparisons where relevant.
21/07/2026 10:16 5.5 points
Topic
The chart shows the percentage of household expenditure on goods and services in a country from 1995 to 2005. Summarise the information by selecting and reporting the main features and make comparisons where relevant.
Word count: 194
Chart/Graph
Essay
Overall Scores
5.5±0.5
Basic
Writing Criteria Scores
TA5.0
CC6.0
LR6.0
GRA6.0
Click on any highlighted text in the essay to view detailed suggestions for improvement.
Deep Analysis
Task 1 - Academic Writing
4 tools available
Sample Essay - IELTS Writing Task 1
No sample essay
Click the button below to analyze and generate a high-quality sample essay for Task 1.