
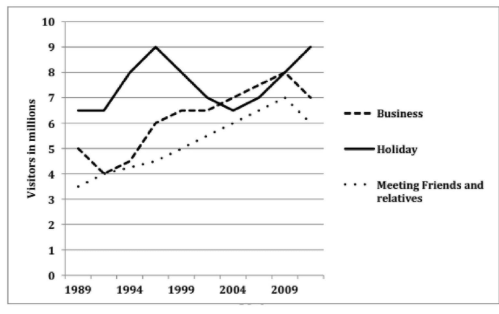
The line graph illustrate about the number of visitors (millions) who traveled for 3 different purposes between 1989 and 2009 Overall, the number of visitors(millions) who traveled for business,holiday,meeting friends and relatives all increased, with holiday becoming the most popular purpose for traveling while meeting friends and relatives remained the least common purpose for visitors . Additionally , the number of visitors who traveled for holiday exhibited fluctuation the most and that of meeting friends and relatives and business increased steadily. In 1989, The number of visitors who traveled for holiday stood at approximately 6,5 million visitors , that of business at about 5 million visitors and that of meeting friends and relatives around 3,5 million visitors . visitors traveled for holiday reached a peak of 9 million people around 1996 and decreased significantly in 2004, while the figure for business, meeting friends and relatives increased slightly from 1990 to 2008,respectively 8 millions and 7 millions people. In 2009 the number of visitors who traveled business, meeting friends and relatives decreased slightly by about 1 million ,respectively 7 million and 6 million people , and the figure for holiday one more times reached a peak at 9 million visitors .
Detail Sampel
The line chart gives information about the number of visitors (millions) who traveled for 3 different purposes from 1989 to 2009
21/07/2026 10:17 5.5 skor
Topik
The line chart gives information about the number of visitors (millions) who traveled for 3 different purposes from 1989 to 2009
Jumlah kata: 200
Grafik/Diagram
Essay
Skor Keseluruhan
5.5±0.5
Dasar
Skor Kriteria Writing
TA5.0
CC6.0
LR6.0
GRA5.0
Klik teks yang ditandai di esai untuk melihat saran detail untuk peningkatan.
Analisis mendalam
Task 1 - Academic Writing
4 tools available
Esai contoh - IELTS Writing Task 1
Belum ada esai contoh
Silakan klik tombol di bawah untuk menganalisis dan membuat esai contoh berkualitas tinggi untuk Task 1.