
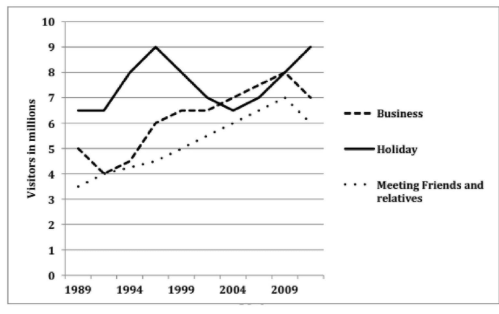
The line graph illustrate about the number of visitors (millions) who traveled for 3 different purposes between 1989 and 2009 Overall, the number of visitors(millions) who traveled for business,holiday,meeting friends and relatives all increased, with holiday becoming the most popular purpose for traveling while meeting friends and relatives remained the least common purpose for visitors . Additionally , the number of visitors who traveled for holiday exhibited fluctuation the most and that of meeting friends and relatives and business increased steadily. In 1989, The number of visitors who traveled for holiday stood at approximately 6,5 million visitors , that of business at about 5 million visitors and that of meeting friends and relatives around 3,5 million visitors . visitors traveled for holiday reached a peak of 9 million people around 1996 and decreased significantly in 2004, while the figure for business, meeting friends and relatives increased slightly from 1990 to 2008,respectively 8 millions and 7 millions people. In 2009 the number of visitors who traveled business, meeting friends and relatives decreased slightly by about 1 million ,respectively 7 million and 6 million people , and the figure for holiday one more times reached a peak at 9 million visitors .
รายละเอียดตัวอย่าง
The line chart gives information about the number of visitors (millions) who traveled for 3 different purposes from 1989 to 2009
21/07/2026 10:17 5.5 คะแนน
หัวข้อ
The line chart gives information about the number of visitors (millions) who traveled for 3 different purposes from 1989 to 2009
จำนวนคำ: 200
แผนภูมิ/กราฟ
Essay
คะแนนรวม
5.5±0.5
พื้นฐาน
คะแนนเกณฑ์การเขียน
TA5.0
CC6.0
LR6.0
GRA5.0
คลิกข้อความที่ไฮไลต์ในเรียงความเพื่อดูคำแนะนำรายละเอียดเพื่อพัฒนา
การวิเคราะห์เชิงลึก
Task 1 - Academic Writing
4 tools available
บทความตัวอย่าง - IELTS Writing Task 1
ยังไม่มีบทความตัวอย่าง
กดปุ่มด้านล่างเพื่อวิเคราะห์และสร้างบทความตัวอย่างคุณภาพสูงสำหรับ Task 1