
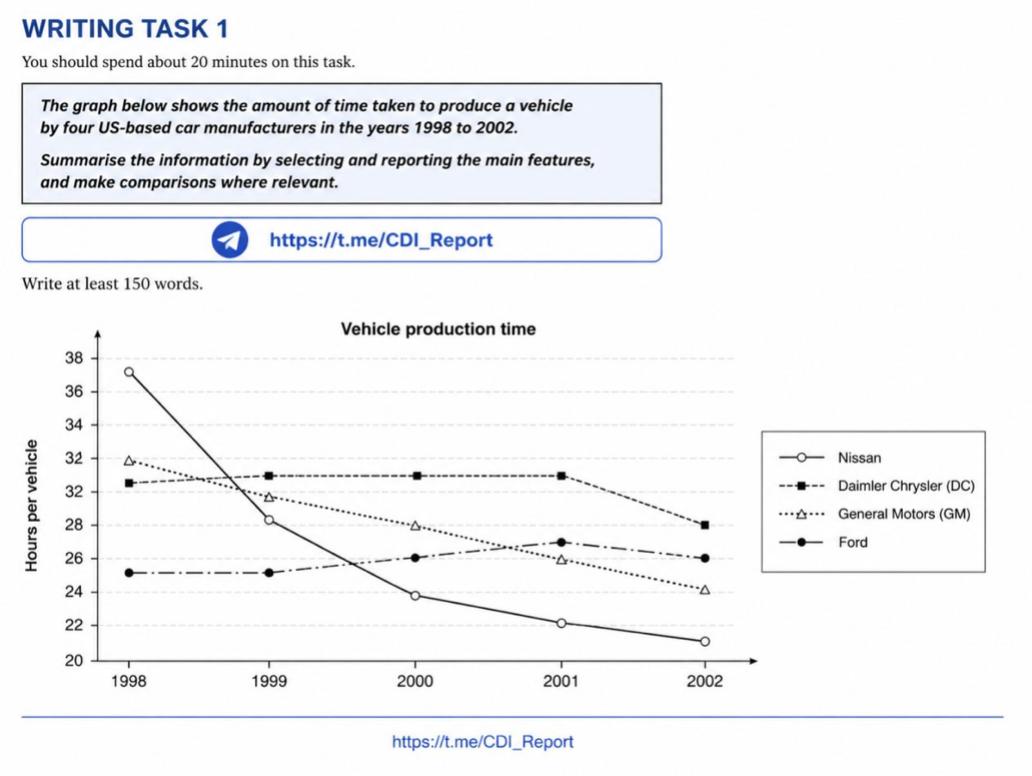
The line graph compares the amount of time taken to produce a single vehicle by four US-based car companies: Nissan, General Motors, Daimler Chrysler, and Ford, between 1998 and 2002. Overall, the figure for Daimler Chrysler ranked first at the end of the period, while that for Nissan stood last. All car manufacturers experienced declines, except for Ford, which increased slightly before declining in the final year. The figures for GM and Nissan fell gradually, with the former accounting for 32 hours in the initial year, then falling by 2 hours annually until 2002, when it reached 24 hours. However, the latter experienced a significant decline from almost 38 hours to 24 hours in the first 2 years before decreasing by nearly 2 hours over the remaining years. Daimler’s figure increased to 33 hours before levelling off between 1999 and 2001, while Ford's remained stable at 25 hours from 1998 to 1999. At the end of the period, Daimler Chrysler recorded 28 hours, whereas Ford stood at 26 hours after increasing gradually between 1999 and 2001
รายละเอียดตัวอย่าง
The graph below shows the amount of time taken to produce a vehicle by four US-based car manufacturers in the years 1998 to 2002.
21/07/2026 10:17 7.0 คะแนน
หัวข้อ
The graph below shows the amount of time taken to produce a vehicle by four US-based car manufacturers in the years 1998 to 2002.
จำนวนคำ: 176
แผนภูมิ/กราฟ
Essay
คะแนนรวม
7.0±0.5
ดีมาก
คะแนนเกณฑ์การเขียน
TA7.0
CC7.0
LR7.0
GRA7.0
คลิกข้อความที่ไฮไลต์ในเรียงความเพื่อดูคำแนะนำรายละเอียดเพื่อพัฒนา
การวิเคราะห์เชิงลึก
Task 1 - Academic Writing
4 tools available
บทความตัวอย่าง - IELTS Writing Task 1
ยังไม่มีบทความตัวอย่าง
กดปุ่มด้านล่างเพื่อวิเคราะห์และสร้างบทความตัวอย่างคุณภาพสูงสำหรับ Task 1