
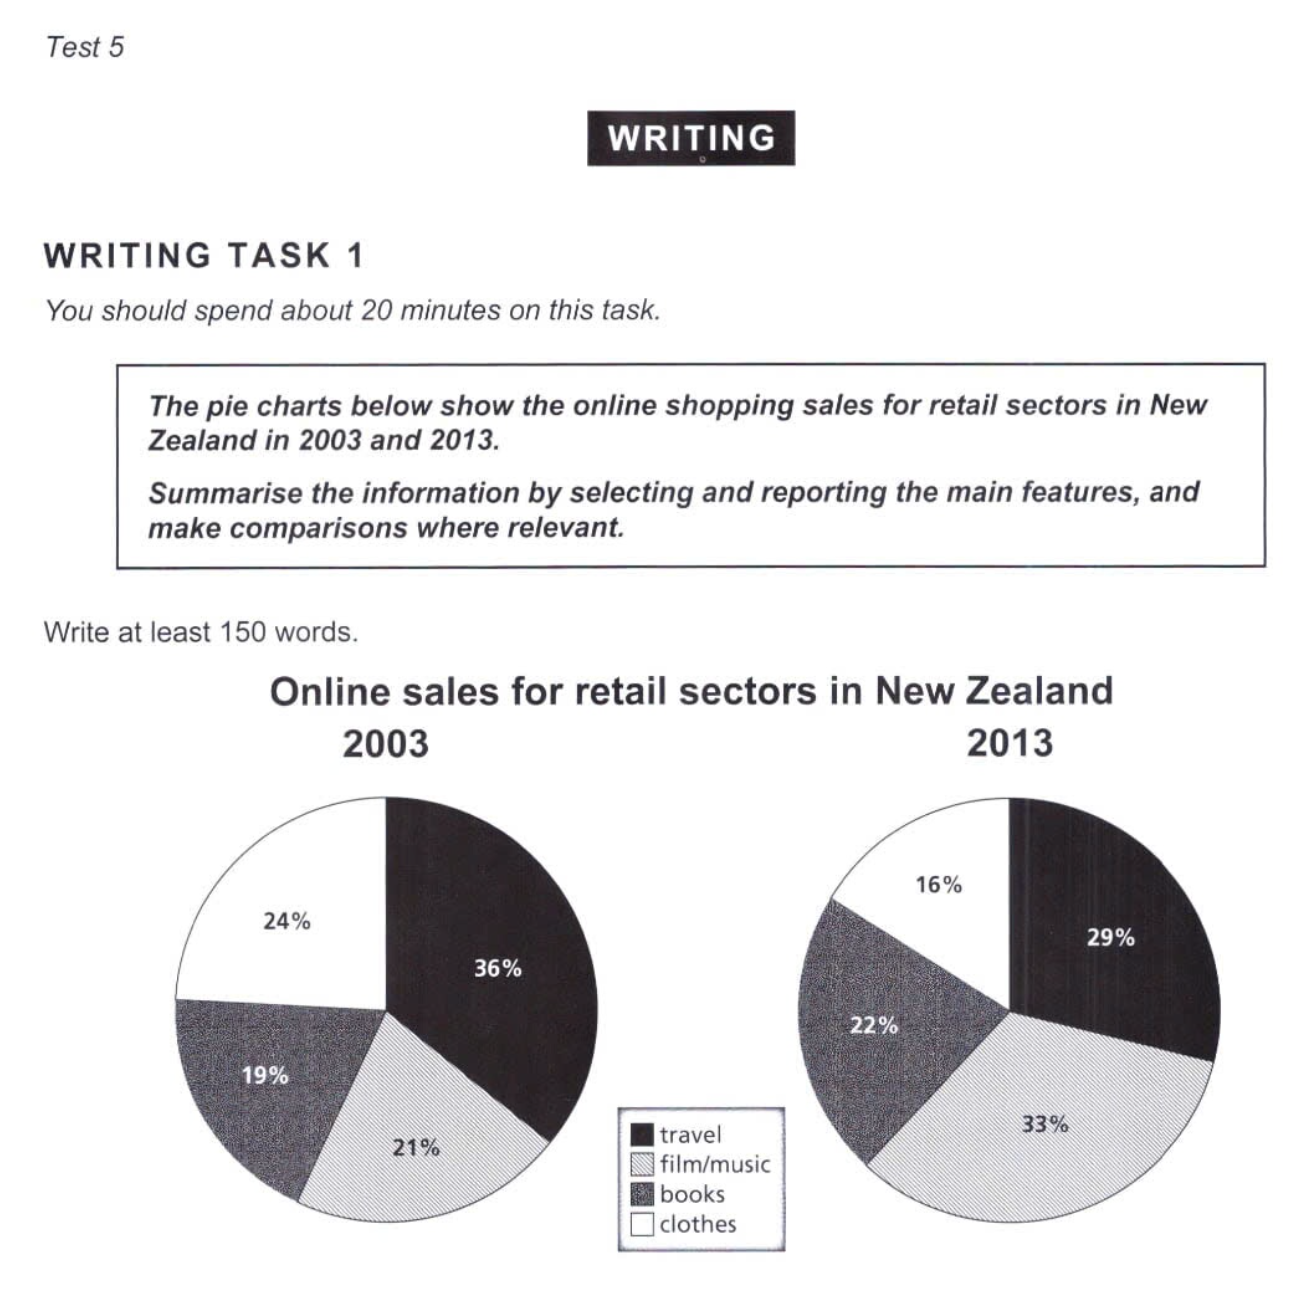
The pie chart illustrates the proportion of online sales for retail sectors in New Zealand in 2003 and 2013. Overall, it is clear that the percentage of books and film and music experienced a significant increase and became the largest retail sectors, whereas the opposite was true for travel and clothes throughout the period. Looking first at books and film and music, they showed a significant rose, starting at 19% and 21% in 2003, respectively. The former increased slightly to 22% in the next decade, while film and music grew sharply to 33%, overtaking travel to become the biggest categories. Moving on to travel and clothes, both figures declined over the period. The percentage of travel accounted for the largest share in 2003, with 36% in the first year before falling slightly to 29% in 2013. Similarly, the figure for clothes dropped dramatically from 24% in 2003 to 16% in the next decade.
Sample Detail
The pie charts below show the online shopping sales for retail sectors in New Zealand in 2003 and 2013.
21/07/2026 10:23 7.0 points
Topic
The pie charts below show the online shopping sales for retail sectors in New Zealand in 2003 and 2013.
Word count: 153
Chart/Graph
Essay
Overall Scores
7.0±0.5
Good
Writing Criteria Scores
TA7.0
CC7.0
LR7.0
GRA7.0
Click on any highlighted text in the essay to view detailed suggestions for improvement.
Deep Analysis
Task 1 - Academic Writing
4 tools available
Sample Essay - IELTS Writing Task 1
No sample essay
Click the button below to analyze and generate a high-quality sample essay for Task 1.