
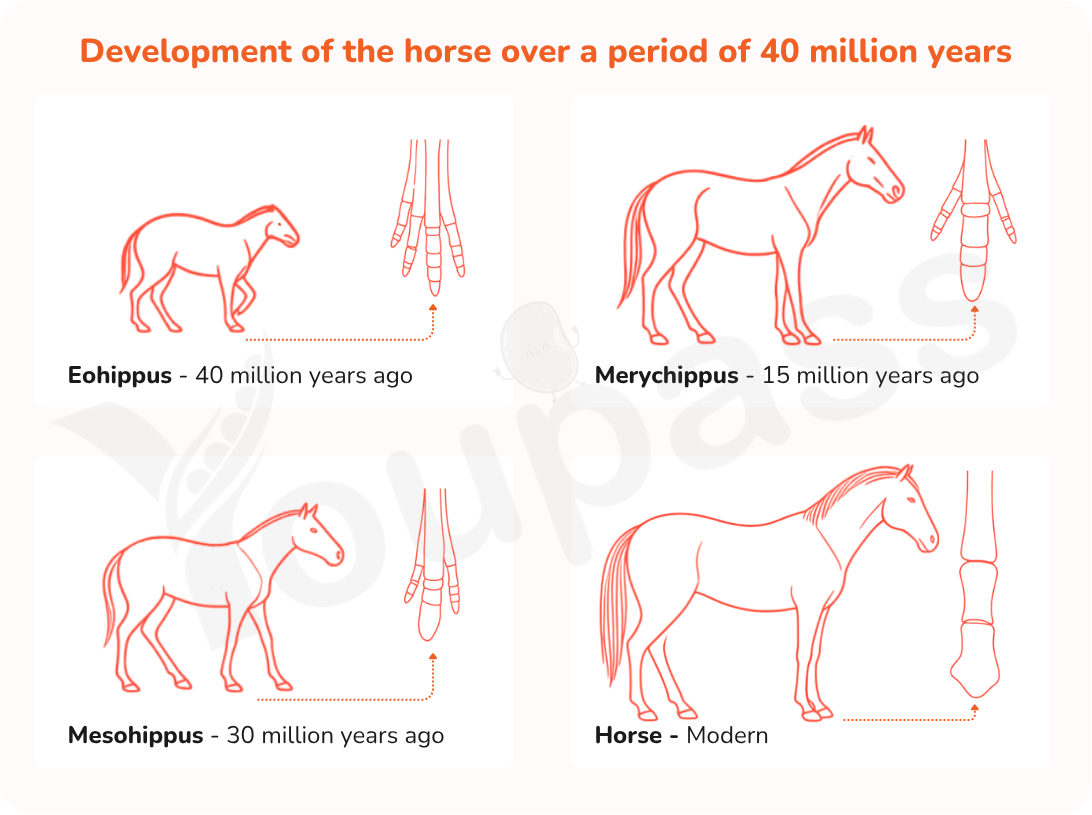
The diagram illustrates the development of horse over a substantial period of 40 million years. In general, there are four main stages in the horse growth, commencing with the earliest species dating back to 40 million years ago and ending with the modern-day horse. Notably, the horse underwent several transformation throughout the surveyed time frame, however, it is noticeable that this creature increases in size and reduces in the number of digits. Regarding the ancient Eohippus existed 40 million years ago. It was the oldest horse species on the chart, with unremarkable appearance with small size and a short tail. Nevertheless, it had the highest number of digits (4) with the most prominent toe lying in the middle. As for its later descendant, named Mesohippus, this creature throve 30 million years ago with a remarkable increase in size but smaller number of digits. Mesohippus had 3 digits, and the middle one was the largest, representing a two-fold increase in size of this part. As for the two latest horses, the Merychippus existing 15 million years ago marked the begin of visual improvements, which appeared with far larger size, contributing to a tough and powerful energy. This species also recorded a discernible increase in the length of tail while remaining identical digit elements to its senior ( Mesohippus). Ultimately, the modern-day horse is the most preferable with intense advancement in size and tail thickness. It simulataneously had thicker mane, whereas the number of digits reduced sharply to only one. These improvements have facilitated rapid mobility and more appealing looks.
Detail Sampel
The diagrams below show the development of the horse over a period of 40 million years. Summarize the information by selecting and reporting the main features, and make comparisons where relevant. Write at least 150 words.
21/07/2026 10:27 7.5 skor
Topik
The diagrams below show the development of the horse over a period of 40 million years. Summarize the information by selecting and reporting the main features, and make comparisons where relevant. Write at least 150 words.
Jumlah kata: 258
Grafik/Diagram
Essay
Skor Keseluruhan
7.5±0.5
Baik
Skor Kriteria Writing
TA8.0
CC8.0
LR7.0
GRA7.0
Klik teks yang ditandai di esai untuk melihat saran detail untuk peningkatan.
Analisis mendalam
Task 1 - Academic Writing
4 tools available
Esai contoh - IELTS Writing Task 1
Belum ada esai contoh
Silakan klik tombol di bawah untuk menganalisis dan membuat esai contoh berkualitas tinggi untuk Task 1.