
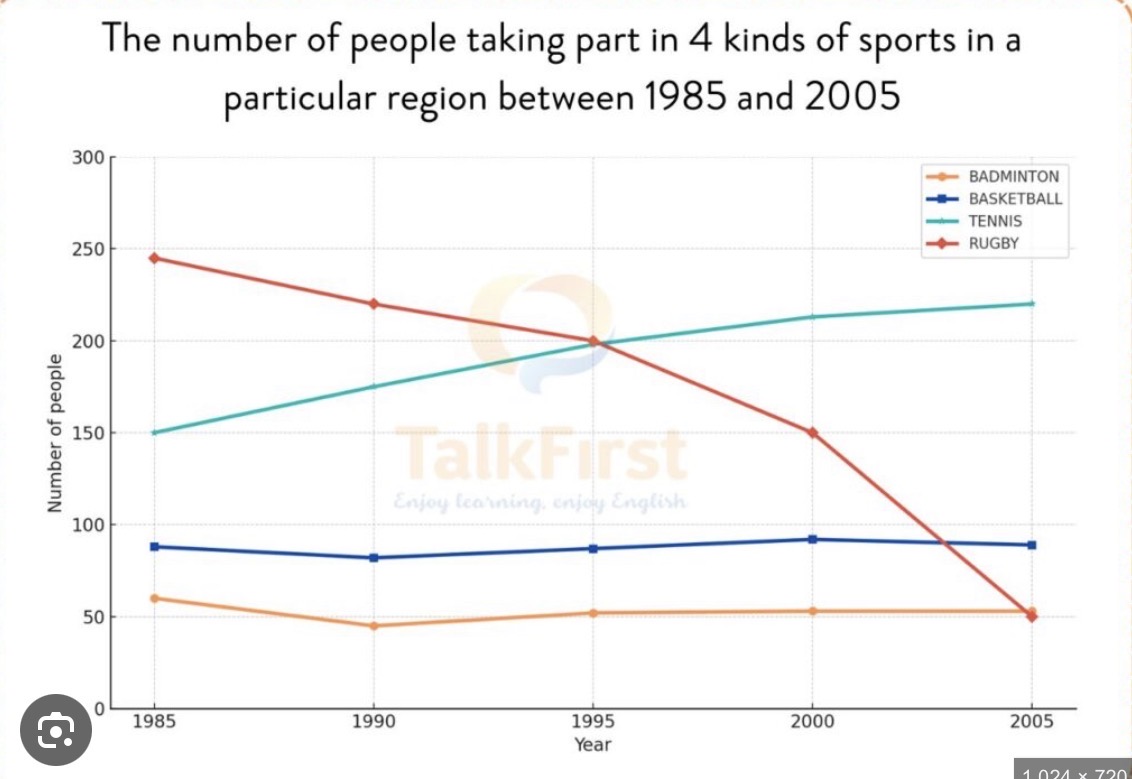
The line graph presents how many people took part in four different kinds of sports in a particular area over a twenty-year period, starting from 1985. What is notable from the chart is that tennis witnessed an upward trend; whereas rugby and badminton exhibited a contrasting pattern and basketball experienced fluctuations. In addition, rugby held the top spot at the beginning; however, this leading position belonged to tennis at the end of the surveyed period. At the start of the period, with 245 people taking part, rugby emerged as the leading sport. Far below was tennis, as its figure stood at 150 people. At the bottom of the list were basketball and badminton, with respective figures being 88 and 60 people. Thereafter, the people taking part in rugby dramatically fell to 50 in 2005. Conversely, tennis registered a significant rise to 220 people in 2005. Meanwhile, there was a fluctuation around 90 people participating in basketball during the surveyed time. The participants of badminton also fluctuated between 45 and 60 from 1985 to 2005.
नमूना विवरण
The number of people taking part in 4 kinds of sports in a particular region between 1985 and 2005
21/07/2026 10:38 8.0 अंक
विषय
The number of people taking part in 4 kinds of sports in a particular region between 1985 and 2005
शब्दों की संख्या: 174
चार्ट/ग्राफ
Essay
समग्र स्कोर
8.0±0.5
उत्कृष्ट
राइटिंग मानदंड स्कोर
TA8.0
CC8.0
LR8.0
GRA8.0
सुधार के विस्तृत सुझाव देखने के लिए लेख में किसी भी हाइलाइट किए गए टेक्स्ट पर क्लिक करें।
गहन विश्लेषण
Task 1 - Academic Writing
4 उपकरण उपलब्ध
नमूना लेख - IELTS Writing Task 1
कोई नमूना लेख नहीं
Task 1 के लिए उच्च-गुणवत्ता वाला नमूना लेख विश्लेषण और बनाने के लिए नीचे दिए गए बटन पर क्लिक करें।