
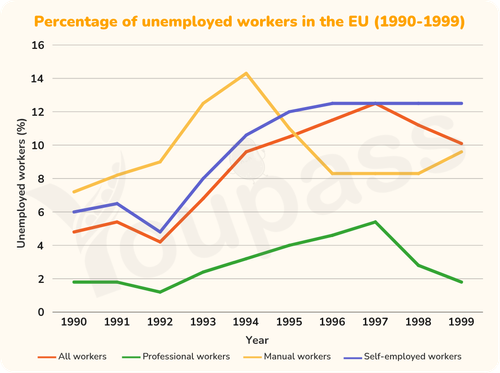
The line graph illustrates the proportion of unemployed workers in Europe from 1990 to 1999 in the four types of jobs, All workers, Professional workers, Manual workers, Self-employed workers. Overall, while the percentage of unemployed workforces in three categories: All workers, Professional workers, Manual workers shows a considerable fluctuation over the period of nine years, the remaining line of Self-employed workers rose and fell, then climbed and staying stable over the remaining 3-year period From 1990 to 1994, the unemployment rate of Manual workers underwent a substantial rise from 7% to over 14%, but followed by a plunge of roughly 6% in 1996. Over the next 2 years, that of Manual workers remained stable at 8% until there was a slight increase to over 9% in the end of the period. In contrast, at the beginning, the unemployment levels of All workers and Self-employed workers both witnessed the same slight drop rate of 1% in the first 2 years. Over the following 5 years, the figure for two mentioned categories significantly soared to 12%. By the last 2 years, contrasting with the stability of the proportion of unemployment workers of Self-employed workers, that of All workers suddenly dropped from 12% to 10% in 1999. Meanwhile, the lowest percentage of all figures, Professional workers, initially marginal decreased to 1% in 1992. Over the period of 5 years, there was a considerable increase to over 5% in that of Professional workers, then finished with a plummet to the first rate, at nearly 2% between 1997 and 1999.
Detail Sampel
The graph below compares the percentage of unemployed workers in the European Union (all workers) with the percentages in the three categories, Professional, Manual and Self-employed. Summarise the information by selecting and reporting the main features, and make comparisons where relevant.
21/07/2026 10:38 6.5 skor
Topik
The graph below compares the percentage of unemployed workers in the European Union (all workers) with the percentages in the three categories, Professional, Manual and Self-employed. Summarise the information by selecting and reporting the main features, and make comparisons where relevant.
Jumlah kata: 255
Grafik/Diagram
Essay
Skor Keseluruhan
6.5±0.5
Cukup
Skor Kriteria Writing
TA7.0
CC7.0
LR6.0
GRA6.0
Klik teks yang ditandai di esai untuk melihat saran detail untuk peningkatan.
Analisis mendalam
Task 1 - Academic Writing
4 tools available
Esai contoh - IELTS Writing Task 1
Belum ada esai contoh
Silakan klik tombol di bawah untuk menganalisis dan membuat esai contoh berkualitas tinggi untuk Task 1.