
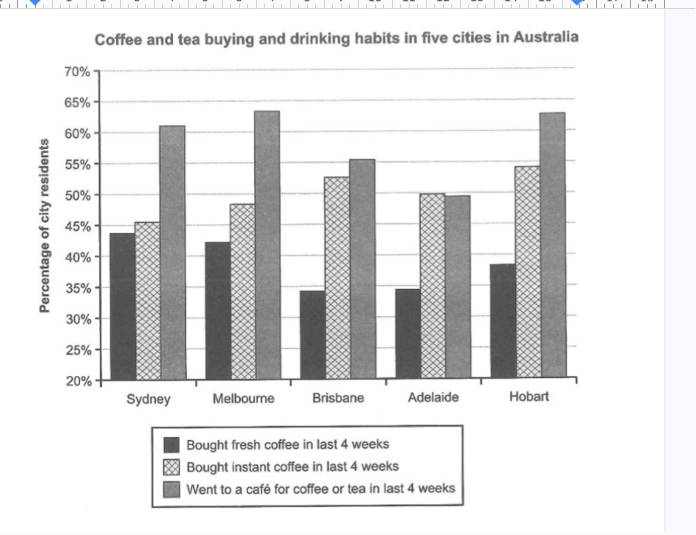
The given bar chart illustrates the proportions of coffee and tea consumption habits in various cities in Australia, namely Sydney, Melbourne, Brisbane, Adelaide and Hobart during the last four weeks. Overall, going to a cafe was the most common habit in all cities, with the exception of Adelaide, whereas purchasing fresh coffee was generally the least preferred option. In addition, instant coffee consistently attracted a higher figure of consumers than fresh coffee across the five cities. Regarding visits to cafes, Melbourne recorded the highest percentages, at approximately 64%, closely followed by Sydney and Hobart, at around 61% and 63% respectively. Brisbane ranked next, with about 55% of its residents going to a cafe in the preceding four weeks, while Adalaide registered the lowest figure, at around 49%. Notably, the percentage of cafe visitors in Melbourne was almost doubled that of fresh coffee purchasers in Brisbane. The popularity of fresh coffee was consistently lower than instant coffee in every city. Sydney and Melbourne accounted for the highest percentages of fresh coffee buyers, at around 44% and 43% respectively, whereas Brisbane and Adelaide shared the lowest figure, at approximately 34%. Hobart stood in the middle, with 38% of residents buying fresh coffee. A contrasting trend can be observed for instant coffee. Hobart topped the ranking, with approximately 55% of residents purchasing instant coffee, followed by Brisbane at 53%. The figures for Adelaide, Melbourne and Sydney were lower, standing at around 50%, 49% and 46% respectively. Notably, Adelaide was the only city in which the proportions of cafe visitors and instant coffee consumers were roughly equal, both standing at approximately 50%.
Sample Detail
Summarise the information by selecting and reporting the main features, and make comparisons where relevant
21/07/2026 10:41 7.0 points
Topic
Summarise the information by selecting and reporting the main features, and make comparisons where relevant
Word count: 268
Chart/Graph
Essay
Overall Scores
7.0±0.5
Good
Writing Criteria Scores
TA7.0
CC8.0
LR7.0
GRA7.0
Click on any highlighted text in the essay to view detailed suggestions for improvement.
Deep Analysis
Task 1 - Academic Writing
4 tools available
Sample Essay - IELTS Writing Task 1
No sample essay
Click the button below to analyze and generate a high-quality sample essay for Task 1.