
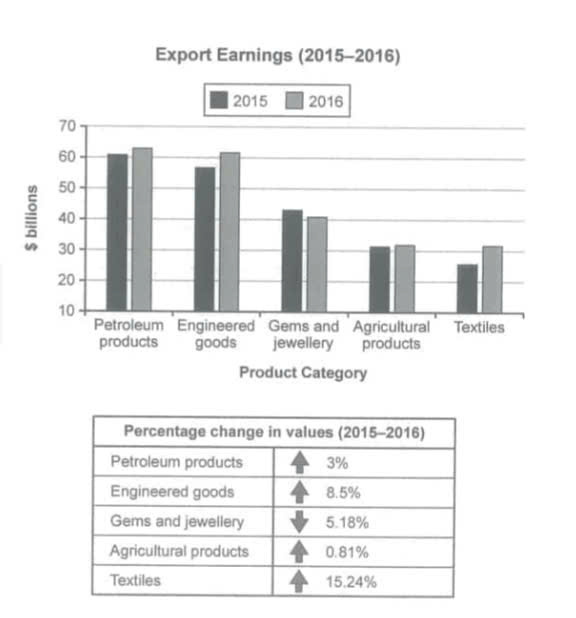
The bar chart shows the export value of one country in five categories in 2015 and 2016. The table shows the percentage change in 2016 compared with 2015. Overall, most categories went up in 2016. However, gems and jewellery went down. Petroleum products and engineered goods had the highest export value in both years. In 2015, petroleum products were about 61 billion dollars. In 2016, they increased to about 63 billion dollars, with 3% growth. Engineered goods also went up from about 58 billion to 62 billion dollars, an increase of 8.5%. Gems and jewellery decreased from about 43 billion to 41 billion dollars. This category fell by 5.18%. Agricultural products were about 31 billion dollars in both years, but they increased a little by 0.81%. Textiles rose from about 26 billion to 31 billion dollars. It had the biggest increase, at 15.24%.
Detail Sampel
The chart below shows the value of one country's exports in various categories during 2015 and 2016. The table shows the percentage change in each category of exports in 2016 compared with 2015. Summarise the information by selecting and reporting the main features, and make comparisons where relevant.
21/07/2026 10:50 6.5 skor
Topik
The chart below shows the value of one country's exports in various categories during 2015 and 2016. The table shows the percentage change in each category of exports in 2016 compared with 2015. Summarise the information by selecting and reporting the main features, and make comparisons where relevant.
Jumlah kata: 143
Grafik/Diagram
Essay
Skor Keseluruhan
6.5±0.5
Cukup
Skor Kriteria Writing
TA7.0
CC7.0
LR6.0
GRA7.0
Klik teks yang ditandai di esai untuk melihat saran detail untuk peningkatan.
Analisis mendalam
Task 1 - Academic Writing
4 tools available
Esai contoh - IELTS Writing Task 1
Belum ada esai contoh
Silakan klik tombol di bawah untuk menganalisis dan membuat esai contoh berkualitas tinggi untuk Task 1.