
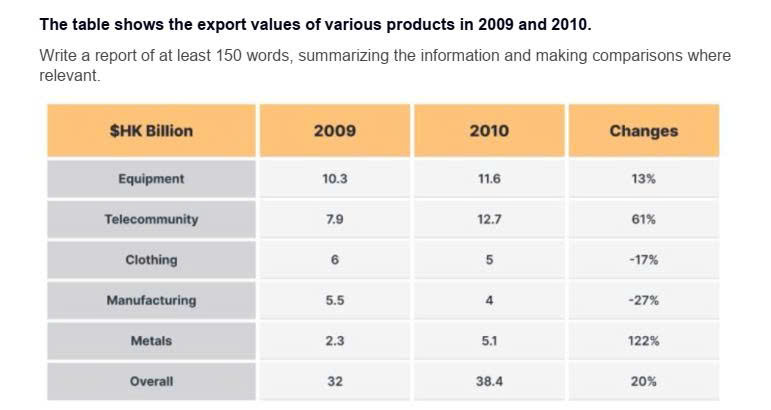
The table gives information about the exportation figures of different commodities in 2009 and 2010. Overall, the value of metals aspect increased noticeably after a year, whereas manufacturing factor had a massive decline. In 2009, the number of exportation in equipment and telecommunity was much higher than others, up to 10,3 and 7,9 billions, respectively. In the same year, however, there was a lack of investment in metals, only 2,3 billions of export value After one year, it is unusual that while every products tended to grow, clothing and manufacturing were decreased by more than 15%. However, equipment and telecommunity were still the most exported products, but the aspect of telecommunity escalated significantly and remained the highest export value in 2010.
Sample Detail
The table shows the export values of various products in 2009 and 2010
21/07/2026 10:51 5.0 points
Topic
The table shows the export values of various products in 2009 and 2010
Word count: 121
Chart/Graph
Essay
Overall Scores
5.0±0.5
Basic
Writing Criteria Scores
TA5.0
CC6.0
LR5.0
GRA5.0
Click on any highlighted text in the essay to view detailed suggestions for improvement.
Deep Analysis
Task 1 - Academic Writing
4 tools available
Sample Essay - IELTS Writing Task 1
No sample essay
Click the button below to analyze and generate a high-quality sample essay for Task 1.