
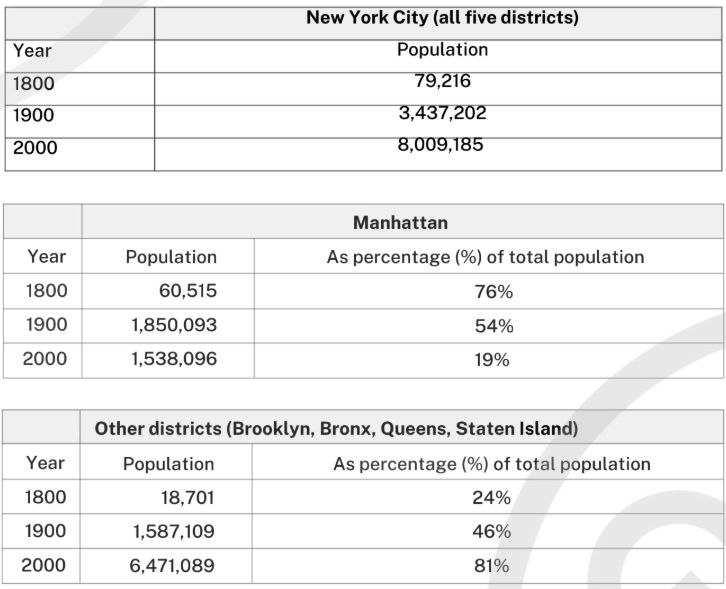
The first table chart compares the total number of population in New York between 1800 and 2000. The second and third tables illustrate changes in the population of the five regions of the city during the same period Overall, New York had a largest proportion of population, while Manhattan figured out for the lowest percentage of total population. In 1800, New York demonstrated the highest rate of the population at 79,216, followed by Manhattan came second at 60,515 people and 76% of total population compared with, other four regions had the lowest figure at 18,701 and only 24%. By 1900, all figures experienced significant growth and New York had the highest figure at 3,437,202 whereas Manhattan and other four regions showed similar figures at 1,850,093, 54% and 1,587,109, 46% respectively. Turn to the last year, New York demonstrated dramatically growth to 8 million people however, Manhattan experienced decline to 1,5 million and 19% of total population. Compared to, other four districts illustrated sharply growth to 6,4 million and 81% of total population.
Sample Detail
The first table below shows changes in the total population of New York City from 1800 to 2000. The second and third tables show changes in the population of the five districts of the city (Manhattan, Brooklyn, Bronx, Queens, Staten Island) over the same period
21/07/2026 10:51 5.5 points
Topic
The first table below shows changes in the total population of New York City from 1800 to 2000. The second and third tables show changes in the population of the five districts of the city (Manhattan, Brooklyn, Bronx, Queens, Staten Island) over the same period
Word count: 172
Chart/Graph
Essay
Overall Scores
5.5±0.5
Basic
Writing Criteria Scores
TA6.0
CC6.0
LR5.0
GRA5.0
Click on any highlighted text in the essay to view detailed suggestions for improvement.
Deep Analysis
Task 1 - Academic Writing
4 tools available
Sample Essay - IELTS Writing Task 1
No sample essay
Click the button below to analyze and generate a high-quality sample essay for Task 1.