
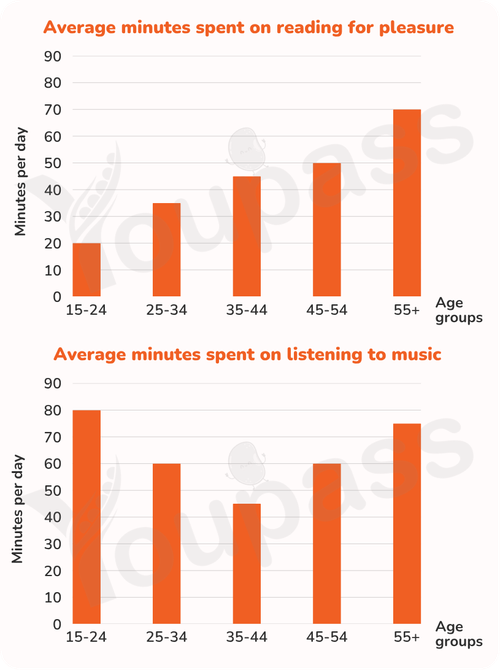
The provided bar charts illustrate the average amount of time per day spent on popular leisure activities across different age brackets in New Zealand. Upon examining the data, it is noticeable that people spent more time on listening to music than reading across almost all age groups. Additionally, the figure for 35-44 age group was remarkably similar in both pleasure activities. To begin with, the 15-24 age group reached a peak of 80 minutes per day in listening to music, compared to only 20 minutes per day in reading. Remarkably, the 35-44 age group were virtually identical, with a figure of approximately 45 minutes per day. Likewise, the 25-34 age bracket prefered listening to music to reading, with the former standing at 1 hour per day and the latter amounting to roughly 35 minutes per day. Similar pattern was observed in 45-54 age cohort (1 hour versus 50 minutes per day) and over-55 age demographic (almost 75 and 70 minutes per day).
รายละเอียดตัวอย่าง
The graphs illustrate the average amount of time per day spent on popular leisure activities for different age groups in New Zealand. Summarize the information by selecting and reporting the main features, and make comparisons where relevant.
21/07/2026 10:53 7.5 คะแนน
หัวข้อ
The graphs illustrate the average amount of time per day spent on popular leisure activities for different age groups in New Zealand. Summarize the information by selecting and reporting the main features, and make comparisons where relevant.
จำนวนคำ: 162
แผนภูมิ/กราฟ
Essay
คะแนนรวม
7.5±0.5
ดีมาก
คะแนนเกณฑ์การเขียน
TA8.0
CC8.0
LR7.0
GRA7.0
คลิกข้อความที่ไฮไลต์ในเรียงความเพื่อดูคำแนะนำรายละเอียดเพื่อพัฒนา
การวิเคราะห์เชิงลึก
Task 1 - Academic Writing
4 tools available
บทความตัวอย่าง - IELTS Writing Task 1
ยังไม่มีบทความตัวอย่าง
กดปุ่มด้านล่างเพื่อวิเคราะห์และสร้างบทความตัวอย่างคุณภาพสูงสำหรับ Task 1