
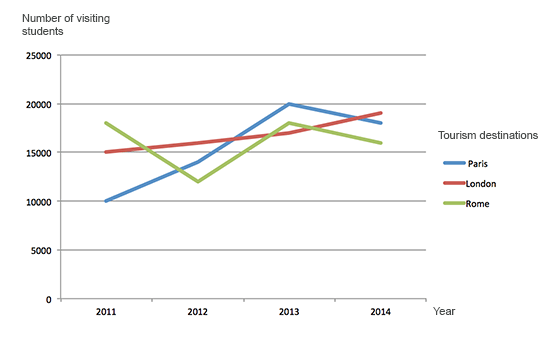
The graph gives information about the number of Venezuelian students visiting three cities of Europe between 2011 and 2014. Overall, the number of students visiting London grew steadily. However, although, surging heavily untill 2013, the vistor's strenght declined for Paris. In case of Rome, the numbers remained fluctuted across the period. In 2011, roughly 10000 Venezuelian students came to Paris. The grew heavily, reaching about 20000 in 2013. However, it fell down steadily thr following year. In contrast, the number of students visiting Rome recorded approximately at 17000 in 2011. For the same period, the strenght remained fluctuted as it dropped to almost 14000 in 2014. In comparison, the numbers for London, standing roughly at 15000 in 2011, grew modertaly over the time, jumping to about 18000 in 2014. In conclusion, it can be said that the avarage of Venezuelian students visting London remainded moderlaty on the up. However, the strenght for Paris heavily increaded before slumping. Meanwhile, the number of vistitors for Rome reamined fluctuated.
नमूना विवरण
The graph below shows tourism statistics among Venezuelian students from 2011 to 2014. Summarize the information by selecting and reporting the main features and make comparisons where relevant.
21/07/2026 11:13 6.0 अंक
विषय
The graph below shows tourism statistics among Venezuelian students from 2011 to 2014. Summarize the information by selecting and reporting the main features and make comparisons where relevant.
शब्दों की संख्या: 166
चार्ट/ग्राफ
Essay
समग्र स्कोर
6.0±0.5
ठीक
राइटिंग मानदंड स्कोर
TA6.0
CC6.0
LR6.0
GRA6.0
सुधार के विस्तृत सुझाव देखने के लिए लेख में किसी भी हाइलाइट किए गए टेक्स्ट पर क्लिक करें।
गहन विश्लेषण
Task 1 - Academic Writing
4 उपकरण उपलब्ध
नमूना लेख - IELTS Writing Task 1
कोई नमूना लेख नहीं
Task 1 के लिए उच्च-गुणवत्ता वाला नमूना लेख विश्लेषण और बनाने के लिए नीचे दिए गए बटन पर क्लिक करें।