
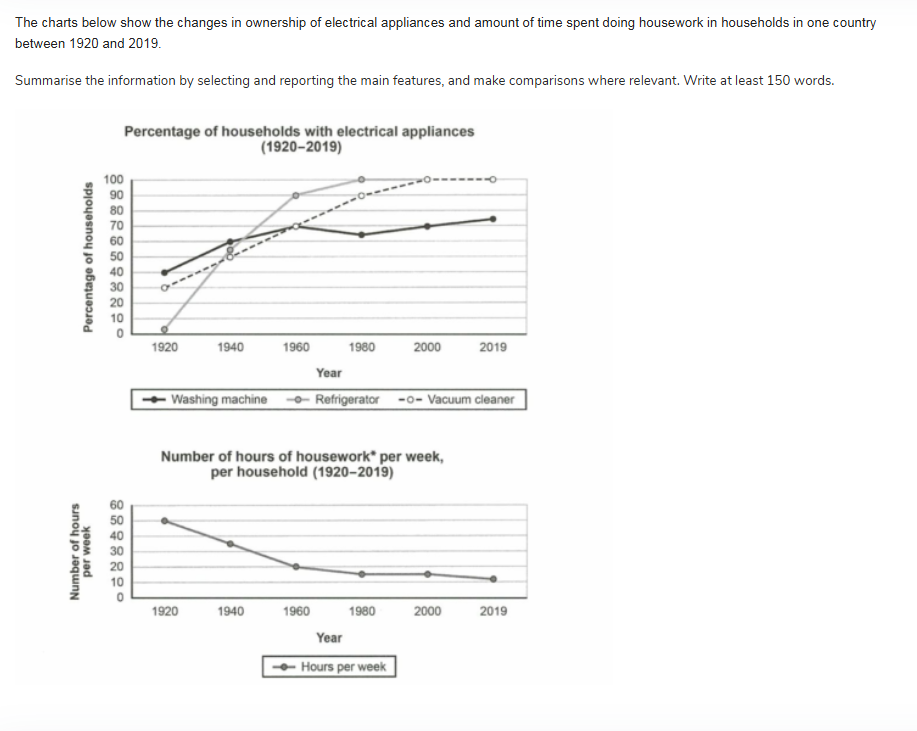
The first chart compares the usage of three electrical appliances of households from year 1920 to 2019. The second chart shows the number of housework per week from 1920 to 2019. Overall, it is clear that refrigerator experienced a maximum rise over the year. While, the least interest was shown by households were on washing machine. In 1920, refrigerator starts from 0%, reached over 50% in 1940, and then rose continously till 1960 by 90% and reached to 100% in 1980. After that, it remains stable till 2019 by 100%. Washing machine started from 40% in 1920 and went to 70% in 1960. After a slightly drop, it reached to 65% in 1980 and then increased slowly and touched 72% by the end of the year. Vacuum cleaner started from 30% and rose sharply till 100% in year 2000 and then remain stable till 2019. The hours spend on these appliances per week was 50% in 1920 which continously dipped to 20% in 1960, After flactuation it reached to 10% in 2019
รายละเอียดตัวอย่าง
The charts below show the changes in ownership of electrical appliances and amount of time spent doing housework in households in one country between 1920 and 2019. Summarise the information by selecting and reporting the main features, and make comparisons where relevant. Write at least 150 words.
21/07/2026 11:26 6.0 คะแนน
หัวข้อ
The charts below show the changes in ownership of electrical appliances and amount of time spent doing housework in households in one country between 1920 and 2019. Summarise the information by selecting and reporting the main features, and make comparisons where relevant. Write at least 150 words.
จำนวนคำ: 172
แผนภูมิ/กราฟ
Essay
คะแนนรวม
6.0±0.5
ดีพอใช้
คะแนนเกณฑ์การเขียน
TA6.0
CC6.0
LR6.0
GRA6.0
คลิกข้อความที่ไฮไลต์ในเรียงความเพื่อดูคำแนะนำรายละเอียดเพื่อพัฒนา
การวิเคราะห์เชิงลึก
Task 1 - Academic Writing
4 tools available
บทความตัวอย่าง - IELTS Writing Task 1
ยังไม่มีบทความตัวอย่าง
กดปุ่มด้านล่างเพื่อวิเคราะห์และสร้างบทความตัวอย่างคุณภาพสูงสำหรับ Task 1