
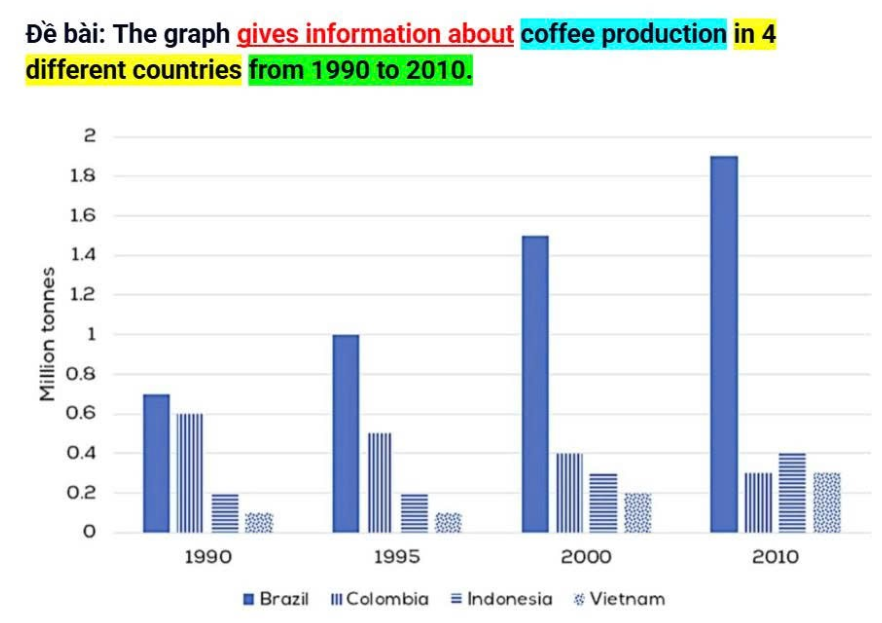
The bar chart describes the number of coffee production in four different countries between 1990 and 2010, measured in tons. It is clear that Brazil had the largest coffee production over the period, it increased significantly and reached a peak at the end. Colombia remained lower and more unstable. By contrast, Indonesia and Vietnam showed an upward trend. Coffee manufacturing in Brazil grew from around 0.7 million tons in 1990 to 1.8 million tons in the final year, the highest figure of the chart. Colombia’s coffee production fell slightly from 0.6 tons in 1990 to 0.3 million tons in 2010 and it was surpassed by Indonesia’s coffee proportion. In contrast, the coffee production of the two countries were smaller. Indonesia remained stable at 0.2 million tons between 1990 and 1995 and then to 0.4 in 2010, becoming the second country to have large coffee production. Vietnam’s coffee creation was the lowest. It showed an upward trend from nearly 0.1 million tons in 1990 to 0.3 million tons in 2010.
Sample Detail
The graph gives information about coffee production in 4 different countries from 1990 to 2010.
21/07/2026 15:23 6.5 points
Topic
The graph gives information about coffee production in 4 different countries from 1990 to 2010.
Word count: 169
Chart/Graph
Essay
Overall Scores
6.5±0.5
Fair
Writing Criteria Scores
TA7.0
CC7.0
LR6.0
GRA7.0
Click on any highlighted text in the essay to view detailed suggestions for improvement.
Deep Analysis
Task 1 - Academic Writing
4 tools available
Sample Essay - IELTS Writing Task 1
No sample essay
Click the button below to analyze and generate a high-quality sample essay for Task 1.