
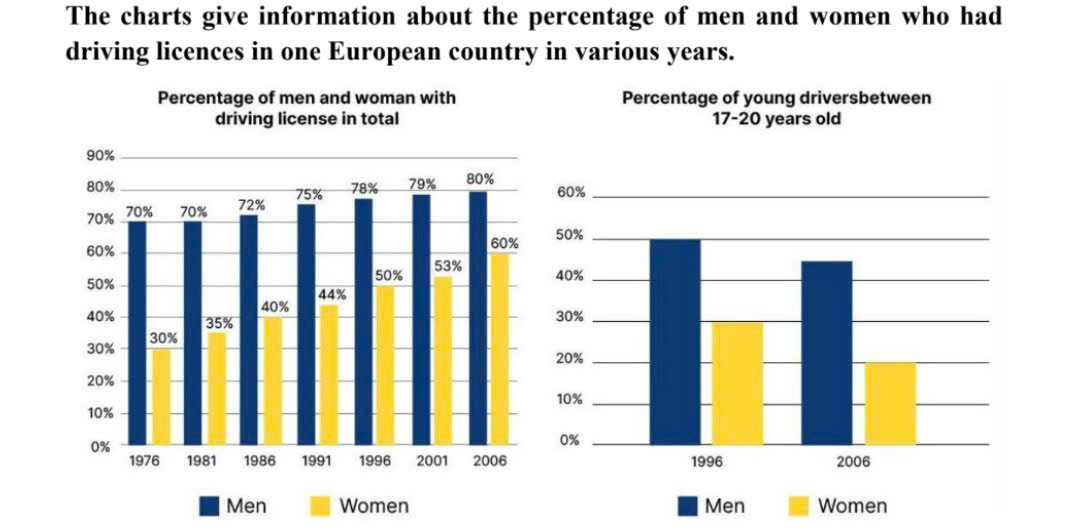
The given bar charts illustrate the percentage of males and females with driving licenses between 1976 and 2006 and the rate of those drivers who aged from 17 to 20 years old over a period of 10 years beginning in 1996 among a European country. Overall, it is evident that both the proportion of men and women having driving licences followed an upward trend during the period shown, albeit men took up much larger percentages than women. By contrast, a gradual decline was witnessed in percentage of young drivers between 17-20 years old of both genders, while the lower rate was still made up by women. Looking first at men, the percentage of men holding driving licences experienced a steady increase, starting at 70% in 1976 and 1981 then climbing to 75% in 1991. The proportion then rose slowly to a peak of 80% at the end of the period. In terms of male drivers aged 17 to 20, the rate fell slightly from 50% in 1996 to nearly 45% in 2006. Regarding women, the share of licensed female drivers rose rapidly. This rate began at just 30%, then it underwent a significant growth to 60% in 2006, doubling the initial figure. Turning to 17-to-20-year-old female drivers, the percentage plunged from 30% to 20% between 1996 and 2006.
Sample Detail
driving licences
21/07/2026 15:27 7.0 points
Topic
driving licences
Word count: 218
Chart/Graph
Essay
Overall Scores
7.0±0.5
Good
Writing Criteria Scores
TA7.0
CC7.0
LR7.0
GRA7.0
Click on any highlighted text in the essay to view detailed suggestions for improvement.
Deep Analysis
Task 1 - Academic Writing
4 tools available
Sample Essay - IELTS Writing Task 1
No sample essay
Click the button below to analyze and generate a high-quality sample essay for Task 1.