
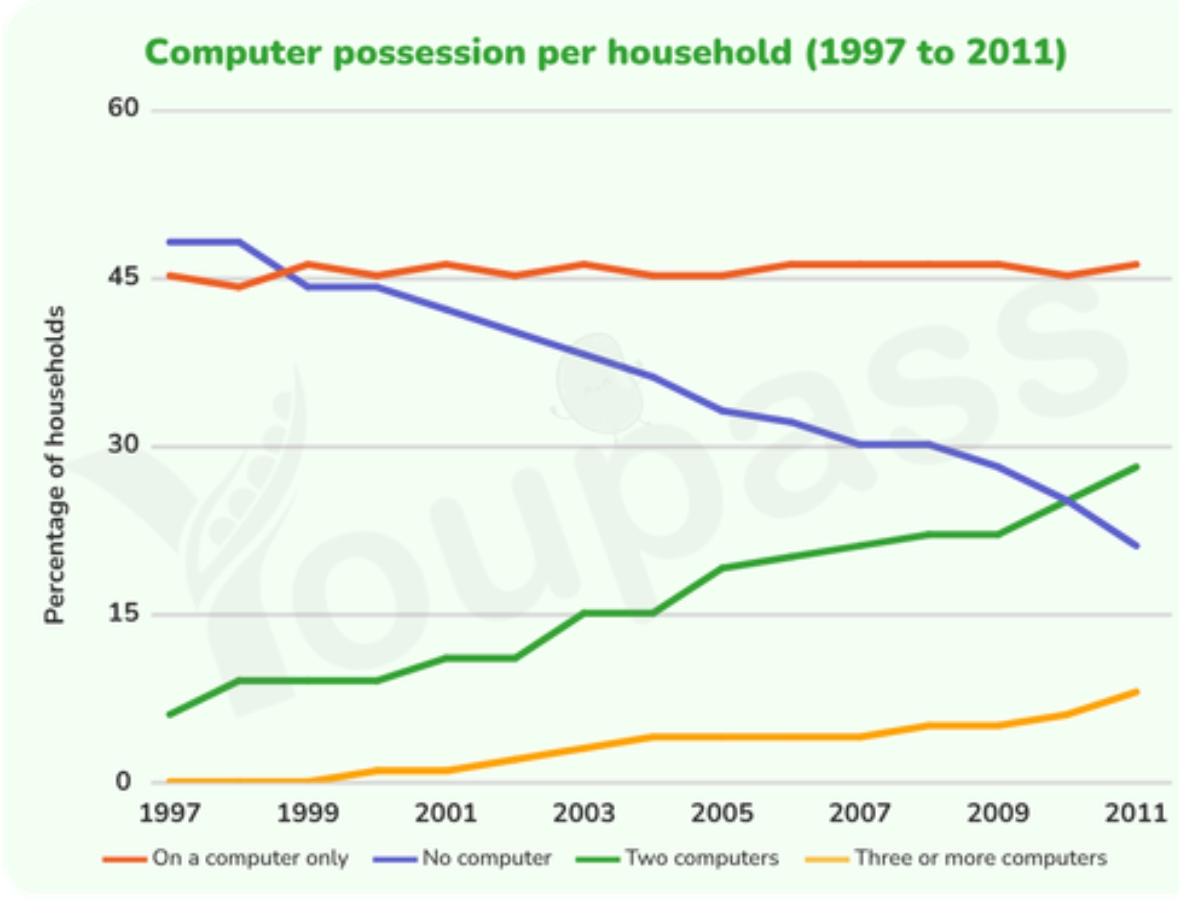
The line graph illustrates the proportion of households possessing different number computers in a European country from 1997 to 2011. Overall, the percentage of households without and possessing one computer declined significantly, those possessing two or more devices increasingly common. Regrading the proportion of households without and owing one computer had downward trend. At the beginning of the period, households without any computer accounted for approximately 48% in 1997, before declining slightly to 45% in 1999. This indicates that computers were not widespread in Europe during the 1990s. In addition, the percentage of households possessing only a computer initially stood at 45% in 1997. Throughout the period, this figure experienced only minimal and insignificant fluctuations, remaining virtually unchanged until the end of the period. Turning to the percentage of households possessing two or more computers had upward trend. At the start of the period, none of the households owned three or more computers during the 1990s. By the 2000s, the figure saw a slight increase, followed by a gradual increase to 8% in 2011. Meanwhile, the proportion of households owing two computers about 8% in 1997 before increasing slightly 15% in 2003 and 2005. After that, the figure continued rise and peaked at approximately 30% in 2011. It can be seen that computers became increasingly popular in Europe.
Sample Detail
The graph below gives information about computer possession by household in one European country between 1997 and 2011. Summarise the information by selecting and reporting the main features, and make comparisons where relevant.
21/07/2026 15:35 5.5 points
Topic
The graph below gives information about computer possession by household in one European country between 1997 and 2011. Summarise the information by selecting and reporting the main features, and make comparisons where relevant.
Word count: 218
Chart/Graph
Essay
Overall Scores
5.5±0.5
Basic
Writing Criteria Scores
TA5.0
CC6.0
LR6.0
GRA6.0
Click on any highlighted text in the essay to view detailed suggestions for improvement.
Deep Analysis
Task 1 - Academic Writing
4 tools available
Sample Essay - IELTS Writing Task 1
No sample essay
Click the button below to analyze and generate a high-quality sample essay for Task 1.