
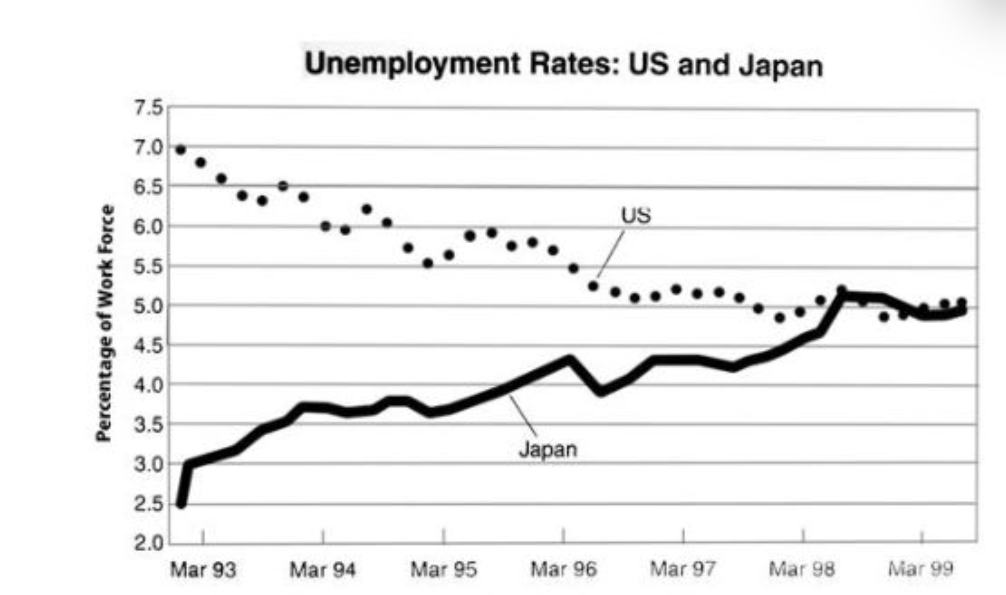
The given chart provides information about the percentage of labour force unemployed in the US and Japan from March 1993 to March 1999 It's clear that the percentage of labour unemployed in the US decreased significantly between March 1993 and March 1999. However, there is a dramatic increase in the unemployment rate in Japan. Firstly, the unemployment rate in the United States hit a peak at 7% in March 1993. However, it dropped a huge amount and went down to the lowest level, about 5%, in March 1999. The percentage of unemployment in US was twice as high as The percentage of unemployment in Japan Unlike the US, the percentage of unemployment in Japan stayed at the lowest point of 2.5%, but it saw a sharp increase and then reached the highest point at 5% in March 1998. Also, in March 1998, the unemployment rates of both countries were almost the same at about 5%.
Sample Detail
The given chart provides information about unemployment rates in the US and Japan from March 1993 to March 1999
21/07/2026 15:41 6.5 points
Topic
The given chart provides information about unemployment rates in the US and Japan from March 1993 to March 1999
Word count: 155
Chart/Graph
Essay
Overall Scores
6.5±0.5
Fair
Writing Criteria Scores
TA7.0
CC7.0
LR6.0
GRA6.0
Click on any highlighted text in the essay to view detailed suggestions for improvement.
Deep Analysis
Task 1 - Academic Writing
4 tools available
Sample Essay - IELTS Writing Task 1
No sample essay
Click the button below to analyze and generate a high-quality sample essay for Task 1.