
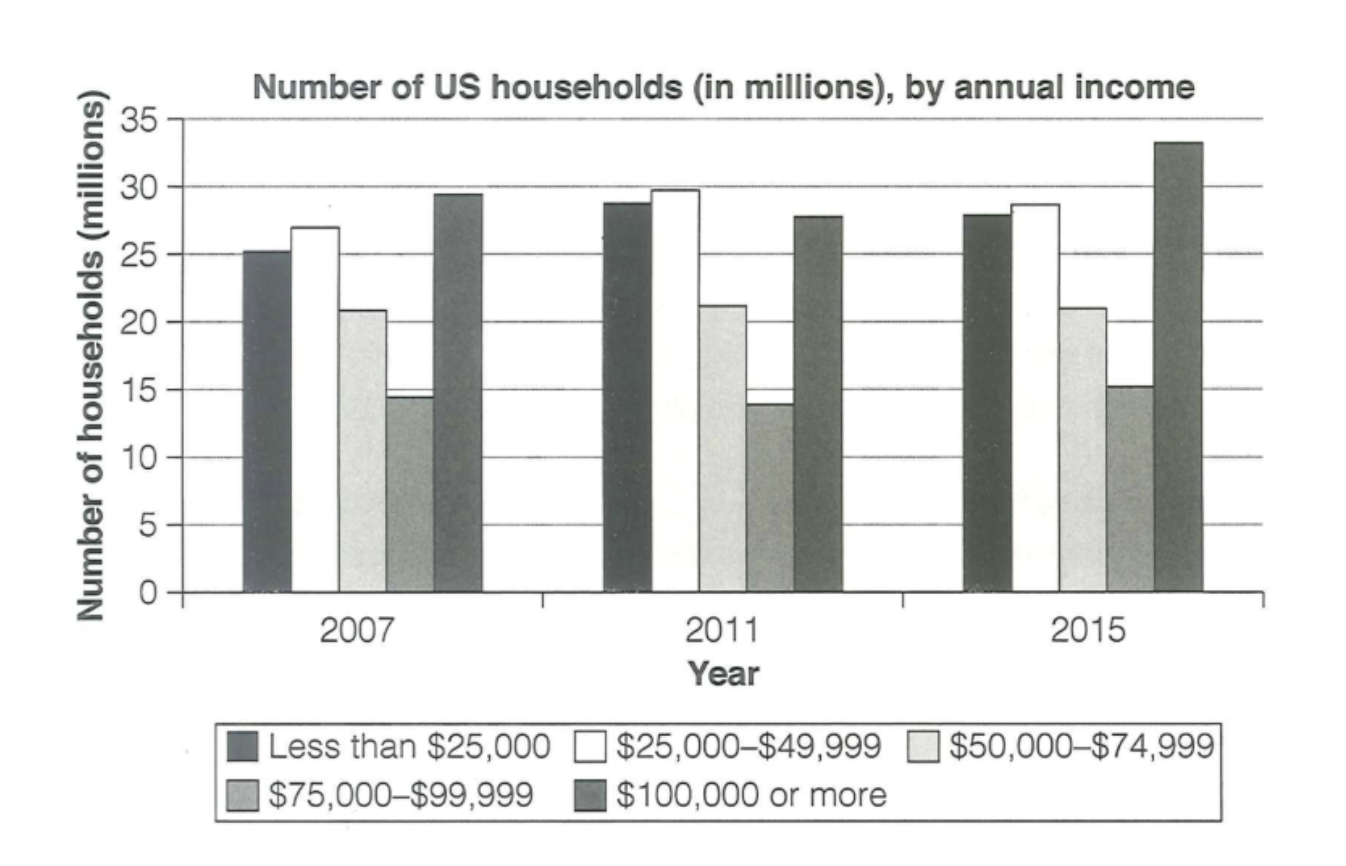
The chart describes the number of households in US through their yearly annual income in 2007, 2011 and 2015. Overall, the group of $100,000 or more led the chart, after that was $25,000–$49,999. Likewise, the group of less than $25,000. Likewise, the annual income group of $50,000–$74,999 witnessed a fluctuation but remained stable. Firstly, the number of households whose yearly income were $100,000 or more accounted for nearly 30 millions in 2007 and reached its peak at over 30 millions in 2015. The group of $25,000–$49,999 witnessed a fluctuation, which was an increase slightly from above 25 millions in 2007 to nearly 30 millions in 2011 and a small decrease to about 26 millions in 2015. In addition, the group of annual money less than $25,000 started at 25 millions, reached its peak by above 28 millions in 2011 and slightly decreased between 2007 and 2015. On the other hand, the others did not see a noticeable change. In 2007, there were about over 20 million households who earned $50,000–$74,999 a year, and it stayed almost unchanged during the period. The corresponding figures for the annual income of $75,000–$99,999 started at near about 15 millions and increased to 15 million.
Detail Sampel
The chart below shows the number of households in the US by their annual income in 2007, 2011 and 2015.
21/07/2026 15:47 6.0 skor
Topik
The chart below shows the number of households in the US by their annual income in 2007, 2011 and 2015.
Jumlah kata: 200
Grafik/Diagram
Essay
Skor Keseluruhan
6.0±0.5
Cukup
Skor Kriteria Writing
TA6.0
CC7.0
LR6.0
GRA6.0
Klik teks yang ditandai di esai untuk melihat saran detail untuk peningkatan.
Analisis mendalam
Task 1 - Academic Writing
4 tools available
Esai contoh - IELTS Writing Task 1
Belum ada esai contoh
Silakan klik tombol di bawah untuk menganalisis dan membuat esai contoh berkualitas tinggi untuk Task 1.