
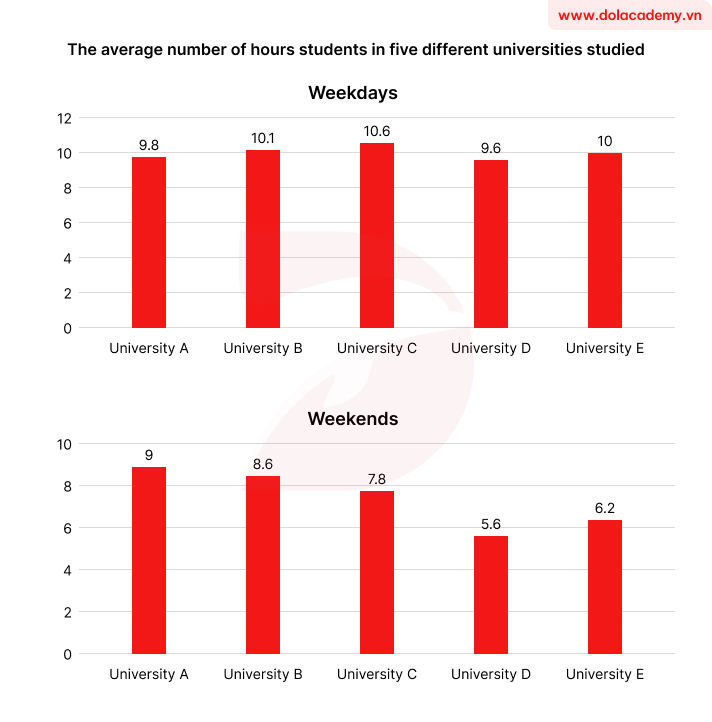
The given bar charts illustrate how many hours students in five distinct universities spend on studying on weekdays and weekends. Overall, although the number of study hours of students during weekdays were relatively similar, there was a huge difference in that at weekends. Notably, students in University C had the highest hours of studying on weekdays, and all students spent less time studying at weekends. On weekdays, undergraduates from University C studied for 10.6 hours, which was much higher than other university students’ study hours. The figures for study hours of students from University B and University E were nearly the same, 10.1 hours and 10 hours, respectively. Students in University A spent 9.8 hours studying, and that number in University D was 9.6. At weekends, people enrolling in University A studied for 9 hours. In addition, the number of study hours of undergraduates from University B was 8.6, nearly 1.5 times as high as that in University D, only 5.6. Finally, students in University C spent 7.8 hours studying, and this figure for University E was 6.2.
নমুনা বিস্তারিত
The bar chart shows the average number of hours students in five different universities studied. Summarise the information by selecting and reporting the main features, and make comparisons where relevant.
21/07/2026 15:49 7.5 স্কোর
টপিক বা বিষয়
The bar chart shows the average number of hours students in five different universities studied. Summarise the information by selecting and reporting the main features, and make comparisons where relevant.
শব্দ সংখ্যা: 178
চার্ট/গ্রাফ
Essay
সামগ্রিক স্কোর
7.5±0.5
ভালো
রাইটিং মানদণ্ড স্কোর
TA8.0
CC8.0
LR7.0
GRA7.0
উন্নতির জন্য বিস্তারিত পরামর্শ দেখতে প্রবন্ধের হাইলাইট করা যেকোনো লেখায় ক্লিক করুন।
গভীর বিশ্লেষণ
Task 1 - Academic Writing
4 tools available
নমুনা রচনা - IELTS Writing Task 1
কোনো নমুনা রচনা নেই
টাস্ক ১-এর জন্য উচ্চমানের নমুনা রচনা বিশ্লেষণ এবং তৈরি করতে নিচের বাটনে ক্লিক করুন।