
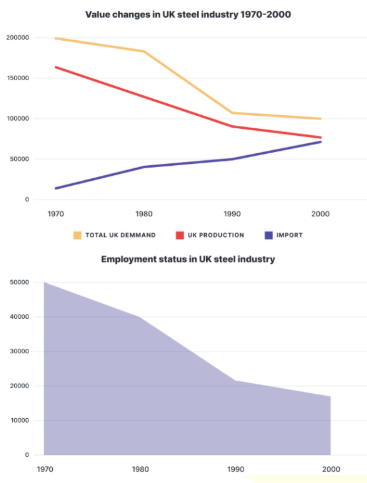
The first line graph compares the value of import, production, and total demand for the steel industry in the UK from 1970 to 2000. At the same time, the second line graph demonstrates the UK’s employment rate in this sector. From an overall perspective, the trend for importing steel in the UK increased gradually, whereas a reverse pattern was observed in their production along with total demand. Besides, the employment status in this industry followed a significant downward trend throughout the period. Regarding the value changes in the UK steel industry, steel import was relatively uncommon, at merely under 20000, contrasting to over 160000 in production in 1970. Thereafter, the UK simultaneously increased its import and decreased its production, as its demand decreased markedly after a 30-year timespan. Eventually, the value of both steel import and production converged at approximately 60000. While those individual counterparts showed mixed trends, the steel industry exhibited a remarkable decline in employment status over the timespan. This rate stood at precisely 50000 in 1970, after which it dropped to under 20000, which was less than 40% of its previous figure. Consequently, the UK residents exhibited less preference towards occupation in the steel industry.
Sample Detail
The line graph shows value changes in the UK steel industry between 1970’and 2000 while the second line chart shows employment status in the same industry.
21/07/2026 15:54 7.0 points
Topic
The line graph shows value changes in the UK steel industry between 1970’and 2000 while the second line chart shows employment status in the same industry.
Word count: 198
Chart/Graph
Essay
Overall Scores
7.0±0.5
Good
Writing Criteria Scores
TA7.0
CC8.0
LR7.0
GRA7.0
Click on any highlighted text in the essay to view detailed suggestions for improvement.
Deep Analysis
Task 1 - Academic Writing
4 tools available
Sample Essay - IELTS Writing Task 1
No sample essay
Click the button below to analyze and generate a high-quality sample essay for Task 1.